CRASH & IMPACT scores
There are some weird quirks in how the CRASH and IMPACT scores behave, and this post examines one of these issues I encountered on this project: Why does the CRASH score’s predicted probability cluster together around 42% and 53% when applied to the NTDB?
Loading relevant code
Unfortunatly because this uses NTDB data, I can’t upload the full repository with data online. But I can post my code, which could be easily adapted assuming that you have access to the data already. So first, we’ll load in the code that calculates the CRASH and IMPACT scores.
source("~/Github/CRASH_IMPACT/prior_models.R") # Get functions to calculate scores
## LOADS TWO FUNCTIONS
### 1. CRASH()
### 2. IMPACT()
We can see the code for the CRASH score below:
print(CRASH)function (age = 40, gcs = 14, extra_injury = F, pupils = c("both",
"one", "neither")[1], return_LP = FALSE)
{
alpha <- log(0.013/0.987)
pupils <- str_to_lower(pupils)
stopifnot(pupils %in% c("both", "one", "neither"), length(pupils) ==
1)
gcs <- 14 - gcs
age <- (age - 40)/10
if (age < 0)
age <- 0
beta_gcs <- log(1.233519)
beta_extra <- log(1.53)
beta_age <- (log(0.176/(1 - 0.176)) - alpha)/4
beta_pupils <- 0
if (pupils == "one")
beta_pupils <- log(0.034/(1 - 0.034)) - alpha
if (pupils == "neither")
beta_pupils <- log(5.539452)
linear_predictor <- alpha + beta_gcs * gcs + beta_extra *
extra_injury + beta_age * age + beta_pupils
p <- 1/(1 + exp(-linear_predictor))
if (return_LP)
return(linear_predictor)
return(p)
}We’ll also load the functions for the calibration plots. I also came across this wonderful post by Darren Dahly on his blog showing how he made pretty calibration plots. I created a function that’s a hybrid between the rms::val.prob() function and Dr. Dahly’s which are used to make the plots in the paper.
source("~/Github/CRASH_IMPACT/cal_plot.R")Examining figure 1
In Figure 1 of the paper, we see big spikes in the CRASH score predicted probability histogram
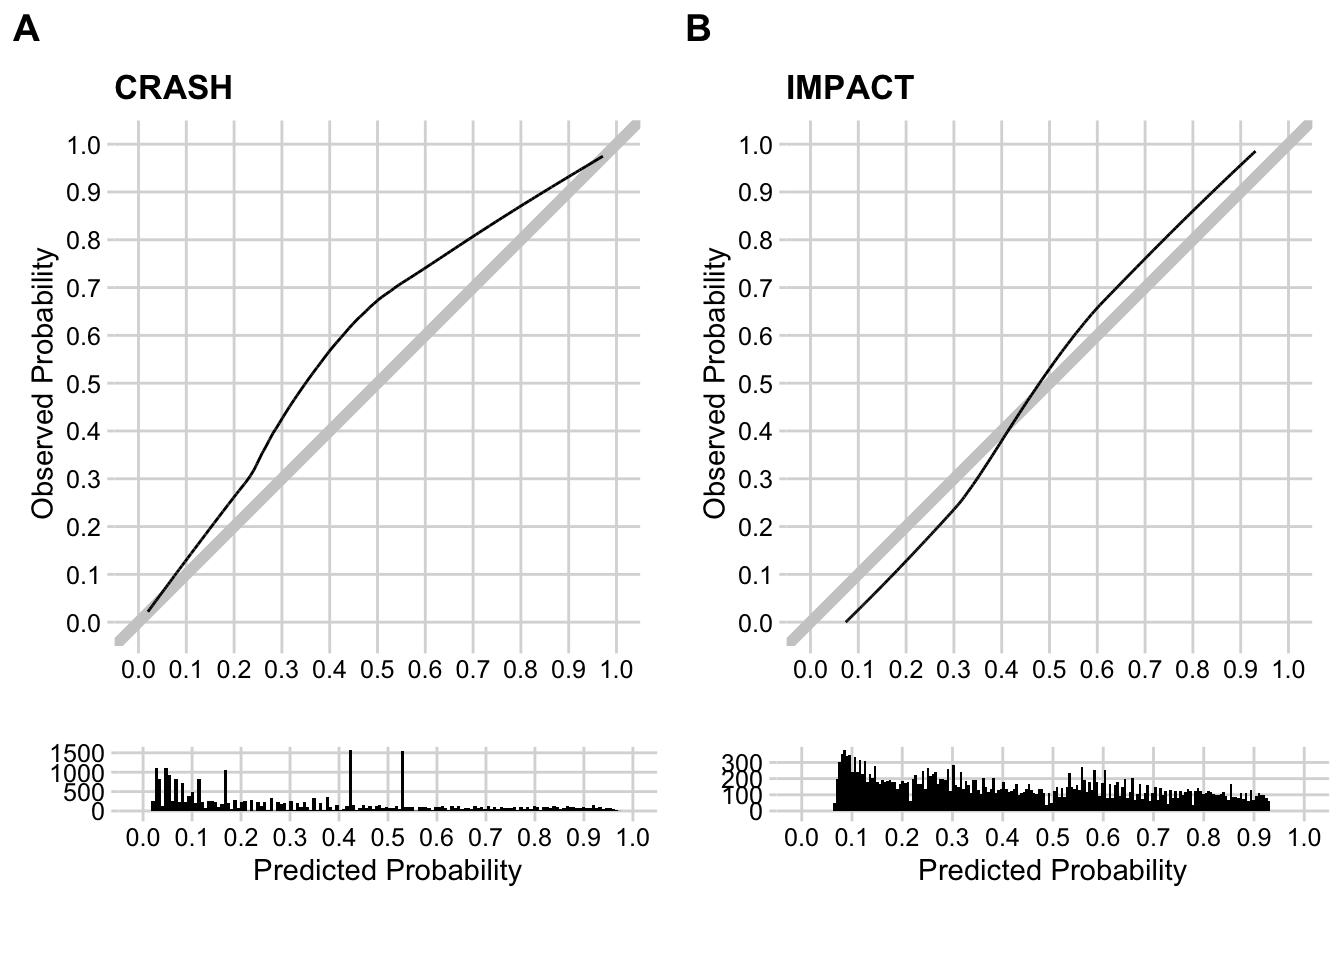
Figure 1: Pre-press version of the figure from the paper
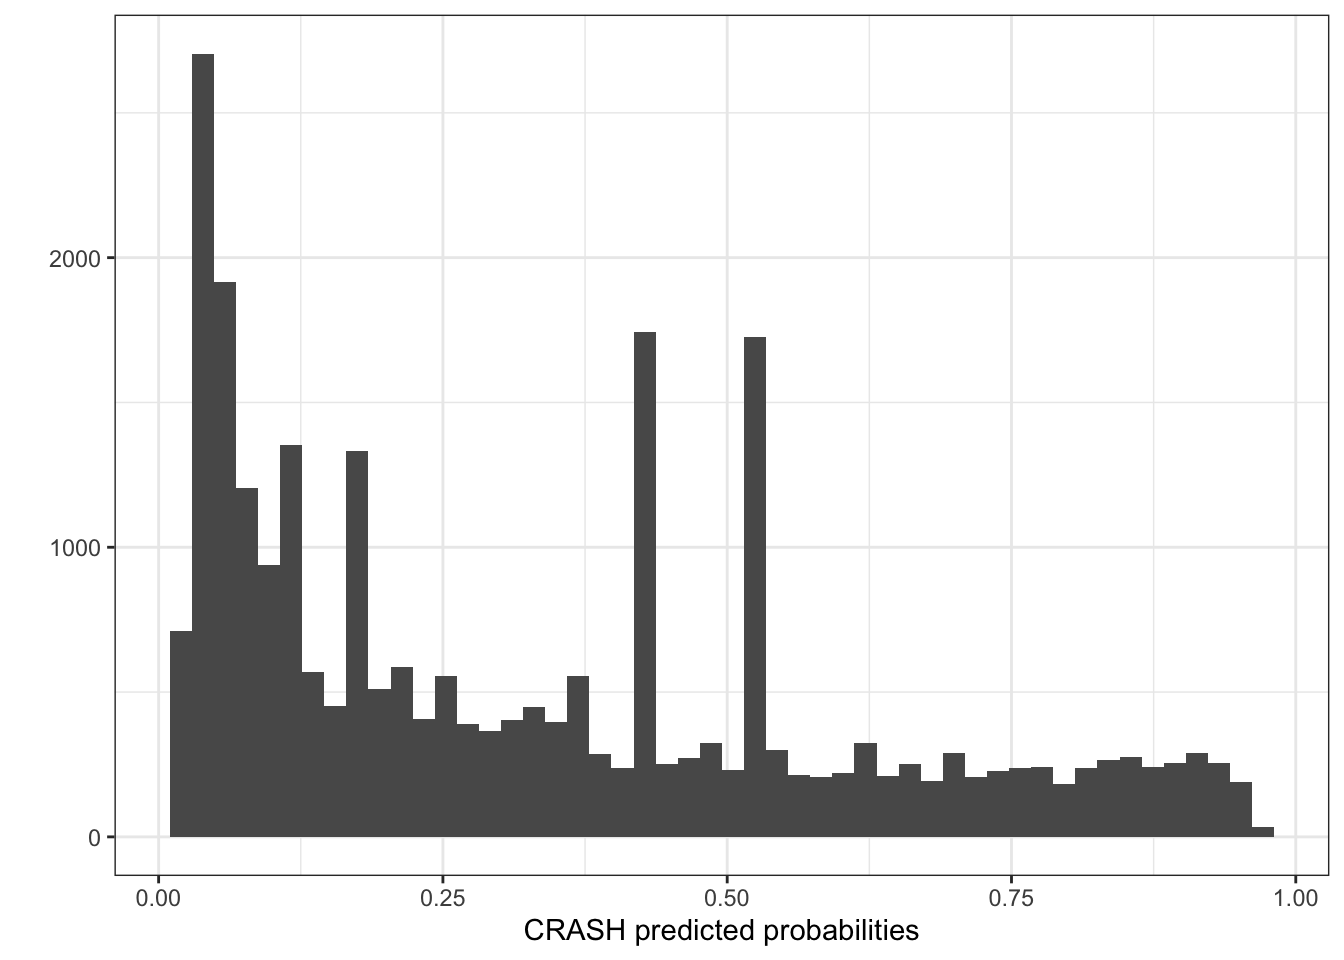
This can be demonstrated better by a dedicated histogram of the predicted probabilities. So what gives?
How each scoring system handles age
The CRASH model considers anyone with an age less than or equal to 40 to have the same “age”, which leads to an odd clumping together of score values for younger patients. Below are the simulated predicted values for CRASH by age and various GCS scores1.
This flat section from ages 18 - 40 is not seen with the IMPACT scores (below).
We can also see that IMPACT uses different linear predictors for each motor GCS, so each line isn’t evenly spaced out like it is with CRASH. Practically, this means that CRASH treats each unit of change in total GCS as having the same effect on predicted mortality (e.g. 5 to 4 means the same 12 to 11).
IMPACT on the other hand, does not make this assumption, and the figure below shows a drop in motor GCS from 3 to 2 is much greater than the change from 2 to 1 (IMPACT also treats a motor GCS of 5 as identical to a motor GCS of 6, which is why you can’t see the line for motor GCS of 5).
Returning to the CRASH histogram
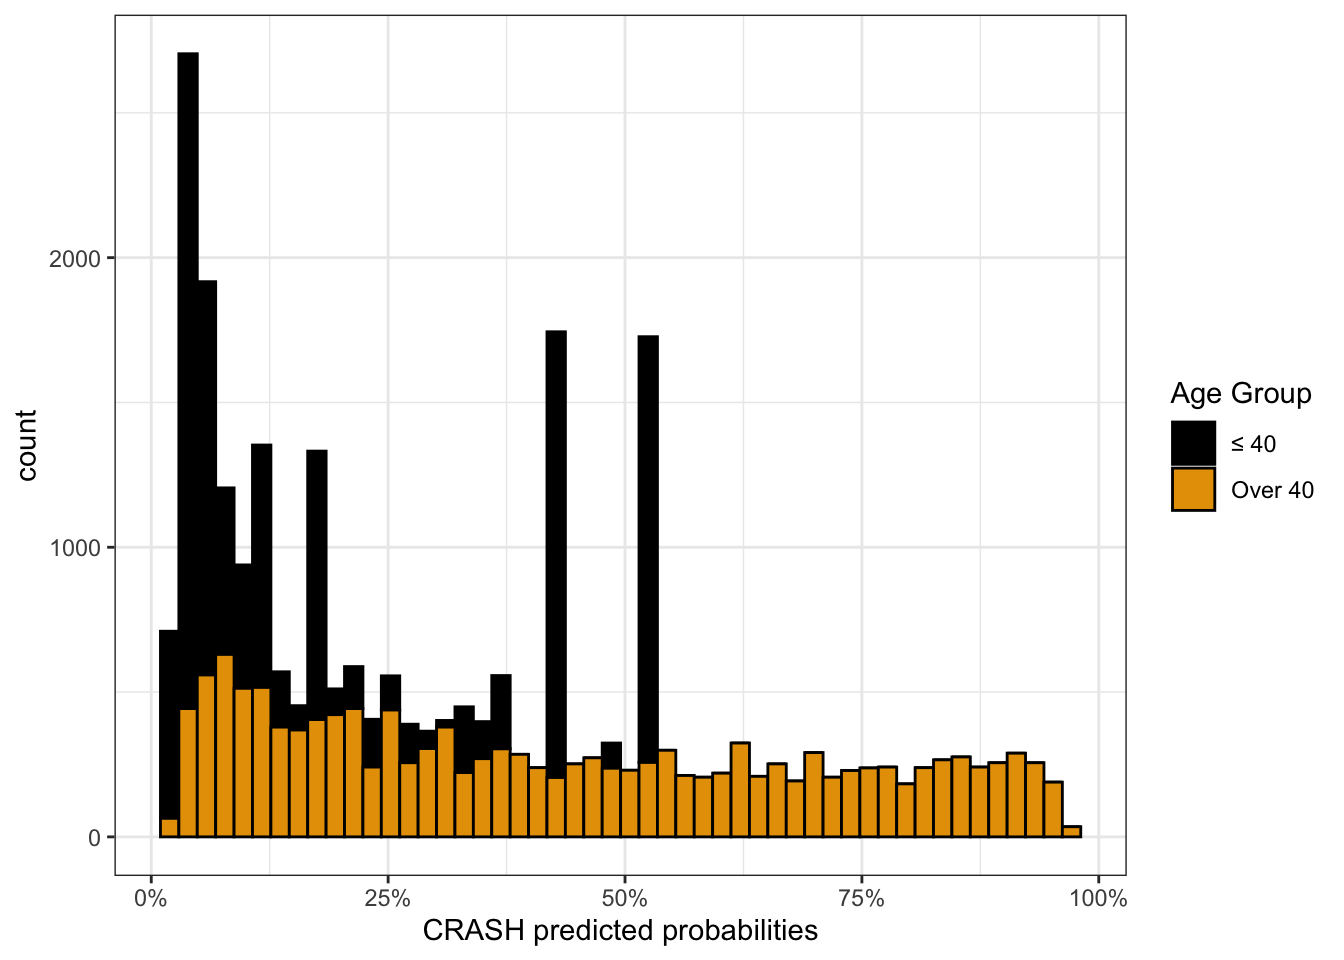
Now, let’s look at the NTDB CRASH scores stratified by AGE <= 40. There’s a pretty even spread for those who are over 40 years of age, and we can see that some of those big spikes are on account of patients who were 40 or younger.
If we stratify by these age groups (horizontal panels) and look at the histogram by pupil reactivity (top row) and presence of extracranial injury (bottom row), we can see why those two big spikes are occuring:
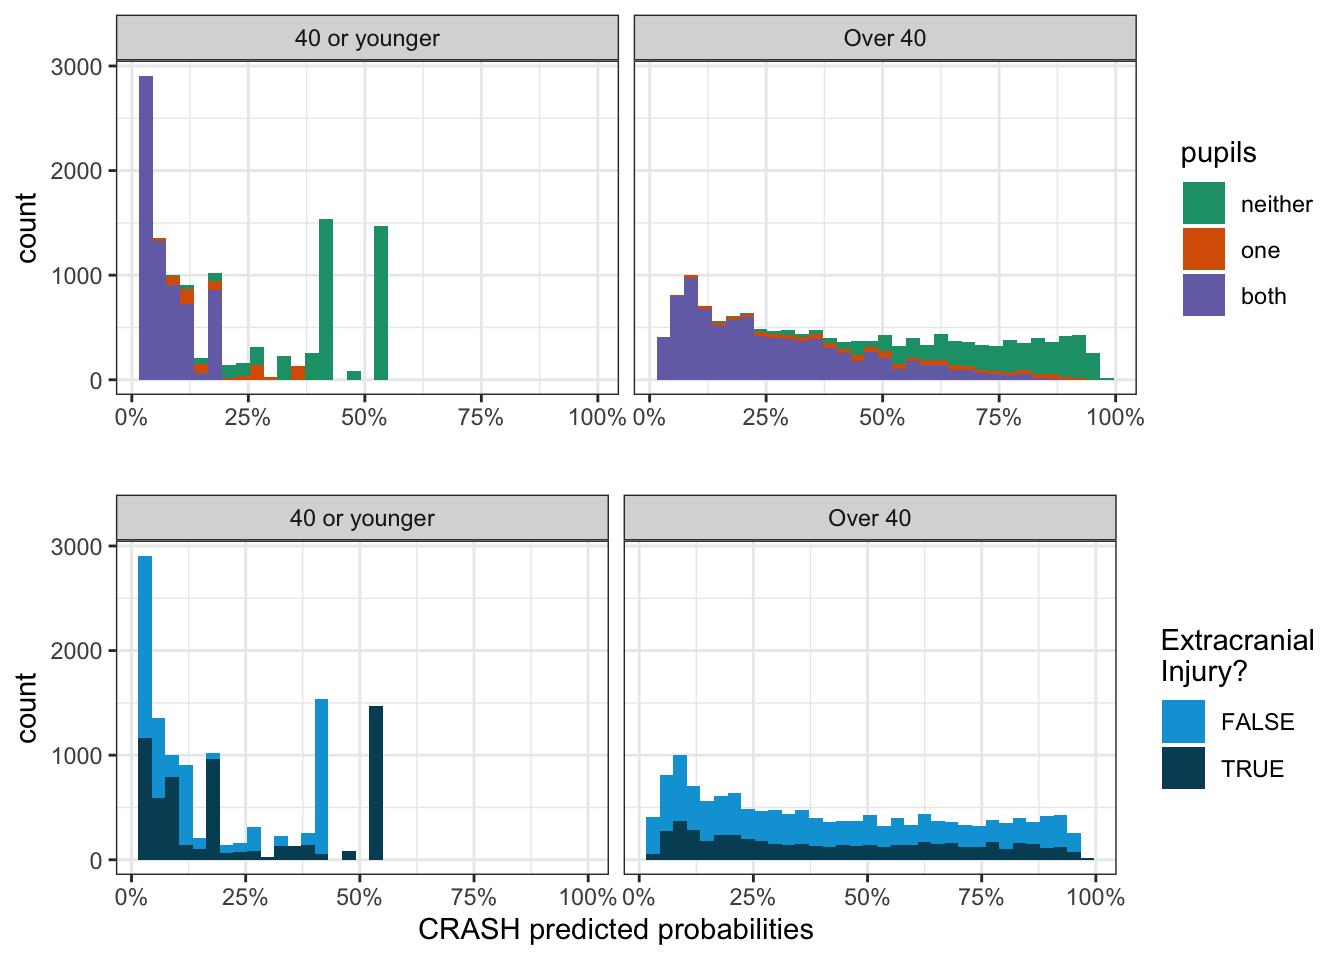
We can now finally see those spikes occur due to all the people who were 40 or younger, with a total GCS of 3, and neither pupil reactive. The spike at 53% occurs if they had extracranial injury and the spike at 42% occrus if they did not:
## YES to extracranial injury
CRASH(age=20, gcs=3, extra_injury = TRUE, pupils="neither")
## [1] 0.5289736


## NO to extracranial injury
CRASH(age=20, gcs=3, extra_injury = FALSE, pupils="neither")
## [1] 0.4232994


## Same score just so long as they're under 40
c(20, 35, 40) %>%
  # map with purrr
  map_dbl(~CRASH(age=.x, gcs=3, extra_injury = FALSE, pupils="neither")) %>%
  round(digits = 3)
## [1] 0.423 0.423 0.423
Scores shown are for patients with no extracranial injury and with both pupils being reactive↩
Hunter Ratliff, MD, MPH
Infectious Diseases Fellow
My research interests include epidemiology, social determinants of health, and reproducible research.