The output below is the code that I used to generate the figures for my Healthy Relationship Text Campaign (HRTC) psoter. I didn’t spend much time documenting on the code, so it likely won’t make any sense unless you’re very familiar with this project.
Source data can be requested from the Behavioral Health and Research department or by contacting me on the contact form on this site.
Bar chart
HRTC %>%
  mutate(Replied = as.character(Replied)) %>%
  mutate(
    Replied = recode(Replied, "0"="No"),
    Replied = recode(Replied, "1"="Yes")
    ) %>%
  count(campg.day, Type, Replied) %>%
  spread(Replied, n) %>%
  group_by(Type) %>%
  summarise(Yes = sum(Yes, na.rm=T), No=sum(No, na.rm=T)) %>%
  mutate(
    `Reply %` = Yes/(Yes+No),
    n         = Yes + No
  ) %>%
  rename(Style=Type) %>%

  ggplot(aes(x=Style, y=`Reply %`, fill=Style)) +
  geom_col(color="black") +
  geom_label(aes(y=0, label=percent(`Reply %`), color=Style), fill="white", vjust=0) +
  scale_fill_manual(values=color_guide, guide=F) +
  scale_color_manual(values=color_guide, guide=F) +
  theme_pubclean() + theme(
    plot.subtitle  = element_text(face="italic", color="#A1A1A1", size=rel(0.9)),
    plot.caption   = element_text(face="bold", color="#2d6987", size=rel(1))
  ) +
  labs(x="", y="Responded (%)", caption = "Fig xyz",
       title="Percent of participants who responded by\nmessage style") +
scale_y_continuous(labels=percent) 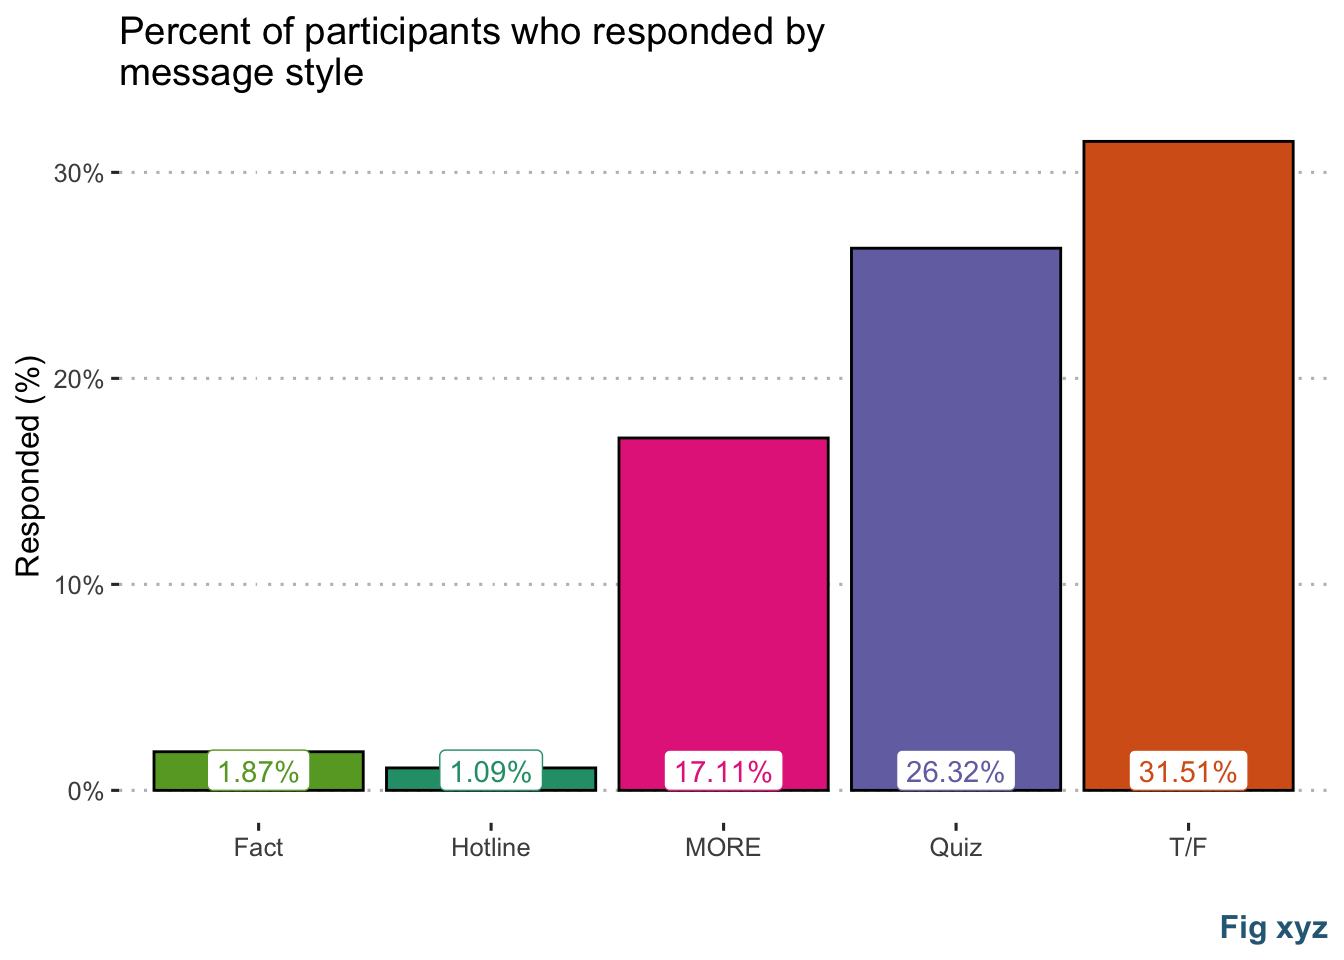
Graphically represent model
Coeffs
df <- HRTC %>%
  filter(userResponses>0) %>%
  # filter(Type!="Fact", Type!="Hotline") %>%
  mutate(Category = as.factor(Category)) %>%
  mutate(Replied = ifelse(Replied==1, "Yes", "No")) %>%
  mutate(Replied = factor(Replied, levels=c("No","Yes")))


mod <- glm(Replied ~ Type + grade + race + gender + userResponses + campg.num,
           data=df, family=binomial(link = "logit"))


# HRTC %>% group_by(Type, BaseMsg, ReplyMsg) %>%
#   summarise(
#     Received = n(),
#     Replied = sum(Replied, na.rm = T),
#     Replied_percent = round(100*sum(Replied, na.rm = T)/n())
#   ) %>%
#   arrange(Type, Received) %>%
#   readr::write_excel_csv("~/Downloads/Message Types.csv")
# Save df with B (estimate) & CIs (and their exp values)
x <- cbind(broom::tidy(mod), broom::confint_tidy(mod)) %>%
rename(B=estimate, LL=conf.low, UL=conf.high) %>%
mutate(expB=exp(B), expLL=exp(LL), expUL=exp(UL)) %>%
mutate(
VarCat = "",
VarCat = ifelse(str_detect(term, "Type"), "Style", VarCat),
term = str_replace(term, "Type", ""),
VarCat = ifelse(str_detect(term, "gender"), "Gender", VarCat),
term = str_replace(term, "gender", ""),
VarCat = ifelse(str_detect(term, "race"), "Race", VarCat),
term = str_replace(term, "race", ""),
VarCat = ifelse(str_detect(term, "grade"), "Grade", VarCat),
term = str_replace(term, "grade", ""),
term = ifelse(VarCat=="Grade", str_c(term, "th"), term),
term = ifelse(term=="Other", str_c(term, VarCat, sep=" "), term)
) %>%
dplyr::select(term, VarCat, B, LL, UL, expB, expLL, expUL, everything()) x %>% filter(VarCat!="") %>%
ggplot(aes(x=term, y=B, color=VarCat)) +
geom_hline(yintercept = 0, linetype = 2) +
geom_point() +
geom_errorbar(aes(ymin=LL, ymax=UL), width=.2) +
coord_flip() + guides(color=F) + theme_bw() +
labs(x="", y="Log-Odds Ratio of responding") +
facet_wrap("VarCat", scales="free")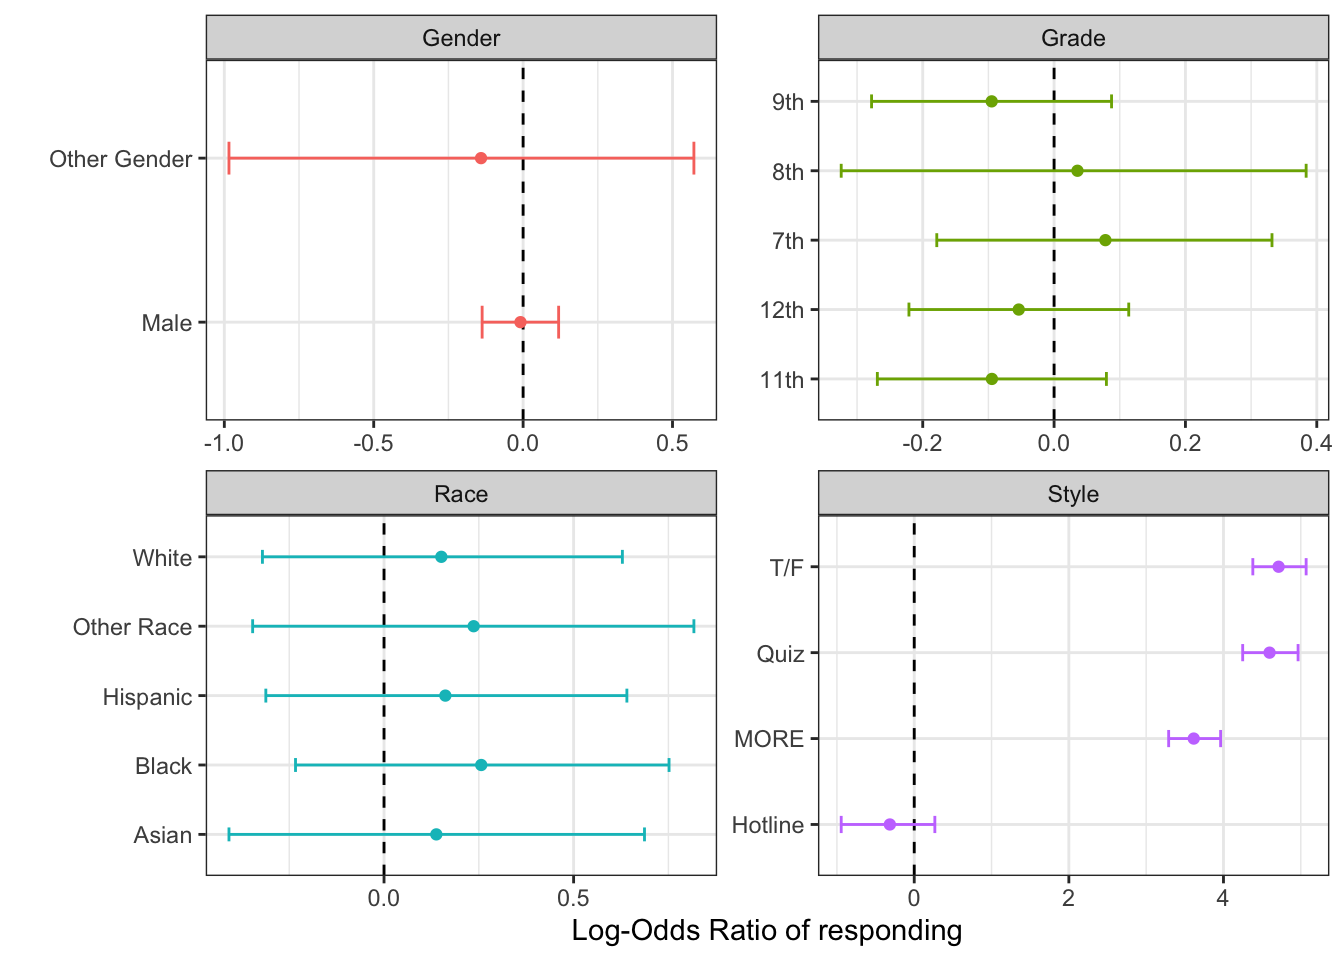
x %>% filter(VarCat!="") %>%
  filter(VarCat=="Style") %>%

  ggplot(aes(x=term, y=expB, color=term)) +
  geom_hline(yintercept = 1, linetype = 1, alpha=1, size=0.75) +
  geom_point(size=2) +
  geom_errorbar(aes(ymin=expLL, ymax=expUL), width=.2, size=1) +
  geom_label_repel(aes(label=round(expB,2)), nudge_x=-0.75, alpha=0.75,
                   arrow = arrow(length = unit(0.02, "npc")), color="black") +


  scale_color_manual(values=color_guide) +
  scale_y_continuous(breaks=c(1,50,100, 150), minor_breaks = c(0,25,75,125)) +
  coord_flip() + guides(color=F) + theme_pubclean(flip=T) +
  theme(panel.grid.minor.x = element_line(linetype = "dotted",
                                          color = "grey"),
        plot.caption       = element_text(face="bold", color="#2d6987", size=rel(1)),
        plot.subtitle      = element_text(face="italic", color="#A1A1A1", size=rel(0.9))) +
  labs(x="", y="Odds ratio of responding", title="Odds of responding to message by message style",
subtitle='Reference = "Fact" message style', caption = 'Fig xyz') 
x %>% filter(VarCat!="") %>%
  filter(VarCat=="Style") %>%
  filter(term!="Hotline") %>% # only look at bidirectional messages

  ggplot(aes(x=term, y=expB, color=term)) +
  geom_hline(yintercept = 1, linetype = 1, alpha=1, size=0.75) +
  geom_point(size=2) +
  geom_errorbar(aes(ymin=expLL, ymax=expUL), width=.2, size=1) +
  geom_label_repel(aes(label=round(expB,2)), nudge_x=-0.4, alpha=0.75,
                   arrow = arrow(length = unit(0.02, "npc")), color="black") +


  scale_color_manual(values=color_guide) +
  scale_y_continuous(breaks=c(1,50,100, 150), minor_breaks = c(25,75,125)) +
  coord_flip() + guides(color=F) + theme_pubclean(flip=T) +
  theme(panel.grid.minor.x = element_line(linetype = "dotted",
                                          color = "grey"),
        plot.caption       = element_text(face="bold", color="#2d6987", size=rel(1)),
        plot.subtitle      = element_text(face="italic", color="#A1A1A1", size=rel(0.9))) +
  labs(x="", y="Odds ratio of responding", title="Odds of responding to bidirectional message styles",
subtitle='Reference = unilateral styles (Fact, Hotline)', caption = 'Fig xyz') 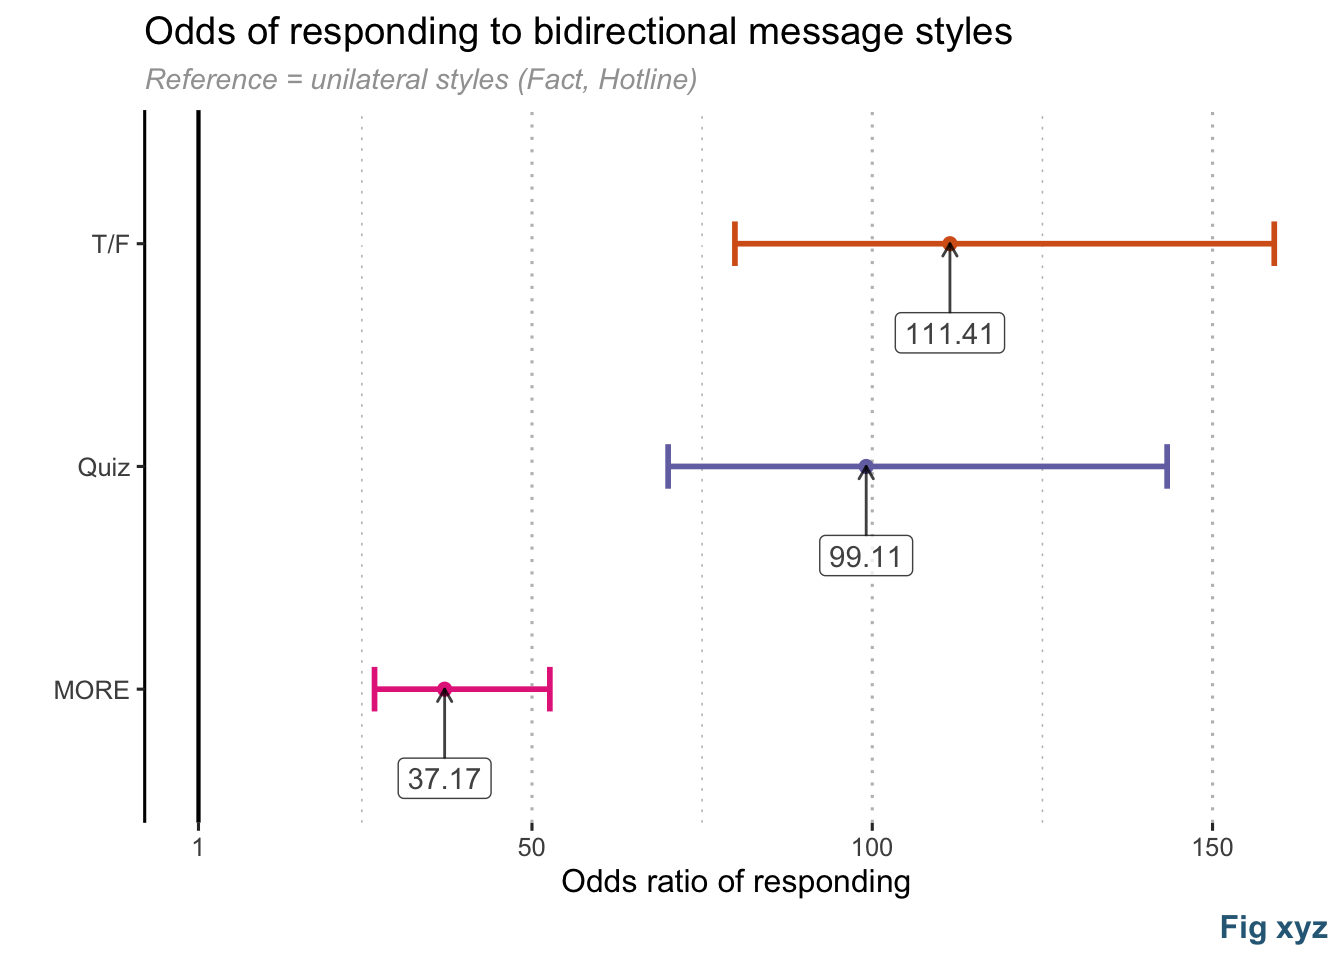
Continious
df <- HRTC %>%
  filter(userResponses>0) %>%
  # mutate(Type = ifelse(campg.day==26, "Hotline", Type)) %>% # Change the one hotline question from MORE to hotline
  mutate(Category = as.factor(Category)) %>%
  mutate(Replied = ifelse(Replied==1, "Yes", "No")) %>%
  mutate(Replied = factor(Replied, levels=c("No","Yes")))

# Use same model as above, but use `campg.day` instead of `campg.num`
mod <- glm(Replied ~ Type + grade + race + gender + userResponses + campg.day,
           data=df, family=binomial(link = "logit"))


## make comparison data....
jtoolResults <- jtools::make_predictions(mod, pred = "campg.day", return.orig.data=T)
predictions <- jtoolResults$predictions
actualData <- jtoolResults$data %>%
  count(campg.day, Type, Replied) %>%
  mutate(Replied = ifelse(Replied==0, "No", "Yes")) %>%
  spread(Replied, n) %>%
  mutate(
    n = Yes + No,
    PercentRespond = Yes/n
  ) %>% left_join(select(count(HRTC, Type, Message, campg.day, campg.num, mid), campg.day, Message))
rm(jtoolResults, predictions)


bind_rows(
  make_predictions(mod, pred = "campg.day", at=list("Type"="MORE")),
  make_predictions(mod, pred = "campg.day", at=list("Type"="Quiz")),
  make_predictions(mod, pred = "campg.day", at=list("Type"="Hotline")),
  make_predictions(mod, pred = "campg.day", at=list("Type"="T/F")),
  make_predictions(mod, pred = "campg.day", at=list("Type"="Fact"))
) %>%

  ggplot(aes(x=campg.day, y=Replied)) +
  # geom_ribbon(aes(ymin=ymin, ymax=ymax, fill=Type), alpha=0.15) +
  geom_line(aes(color=Type)) +
  scale_fill_manual(values=color_guide, guide=F) +
  geom_point(aes(x=campg.day, y=PercentRespond, color=Type, shape=Type),
             size=2, data=actualData, alpha=0.4) +
  scale_color_manual(values=color_guide, name="Style") +
  scale_shape_discrete(name="Style") +
  guides(
    colour = guide_legend(override.aes = list(alpha = 1), reverse=T),
    shape = guide_legend(reverse=T)) +
  theme_pubclean() +
  theme(
    legend.position= "right",
    plot.subtitle  = element_text(face="italic", color="#A1A1A1", size=rel(0.9)),
    plot.caption   = element_text(face="bold", color="#2d6987", size=rel(1))
  ) +
  labs(x="Day of Campaign", y="Pr(respond)", caption = "Fig xyz",
       title="Predicted chance of responding\nby campaign day") +
scale_y_continuous(labels=percent) 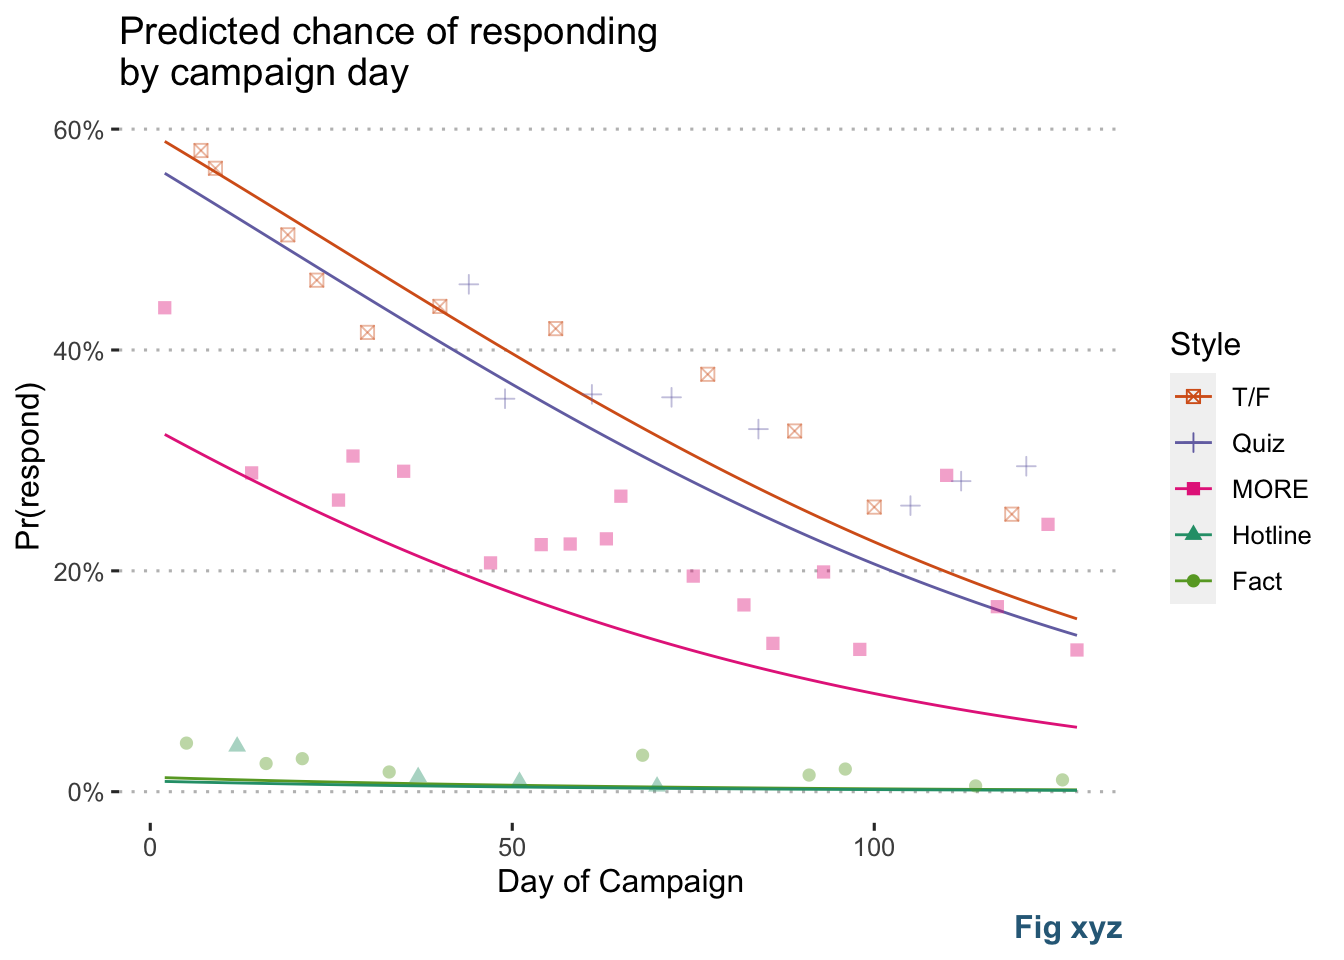
rm(actualData)Survival
survObj <- Surv(time=users$SurvEnd2, event=users$Censor)
SurvPlot <- survfit(survObj ~ 1, data = users) %>%
  ggsurv(size.est=1, size.ci=0.5,cens.size=3,
         lty.ci = 1 # linetype: was 5
    )
# SurvPlot  ## Plot the GGally plot

# Make your own plot
dat <- SurvPlot$data
dat.cens <- subset(dat, cens != 0)
dat %>%
  ggplot(aes(x=time, y=surv)) +
  geom_ribbon(aes(ymin=low, ymax=up), alpha=0.25) +
  geom_step() +
  geom_point(data=dat.cens, aes(y = surv, color="= Censored"),
      shape=3, size=1.5) +
  # geom_rug(data=count(HRTC, campg.day, Type), sides="b",
  #        aes(x=campg.day, y=0, color=Type), size=1) +

  theme_pubclean() +
  # theme(legend.position=c(0.5,0.1), legend.direction="horizontal") +
   theme(
    legend.position= c(0.2,0.2),
    plot.subtitle  = element_text(face="italic", color="#A1A1A1", size=rel(0.9)),
    plot.caption   = element_text(face="bold", color="#2d6987", size=rel(1))
  ) +
  scale_y_continuous(labels = scales::percent, limits=c(0.6,1)) +
  scale_color_manual(values=c("#df382c"), name="") +
  labs(x="Day of Campaign", y="Subscribed to campaign (%)", caption = "Fig xyz",
       title = "Retention during the campaign")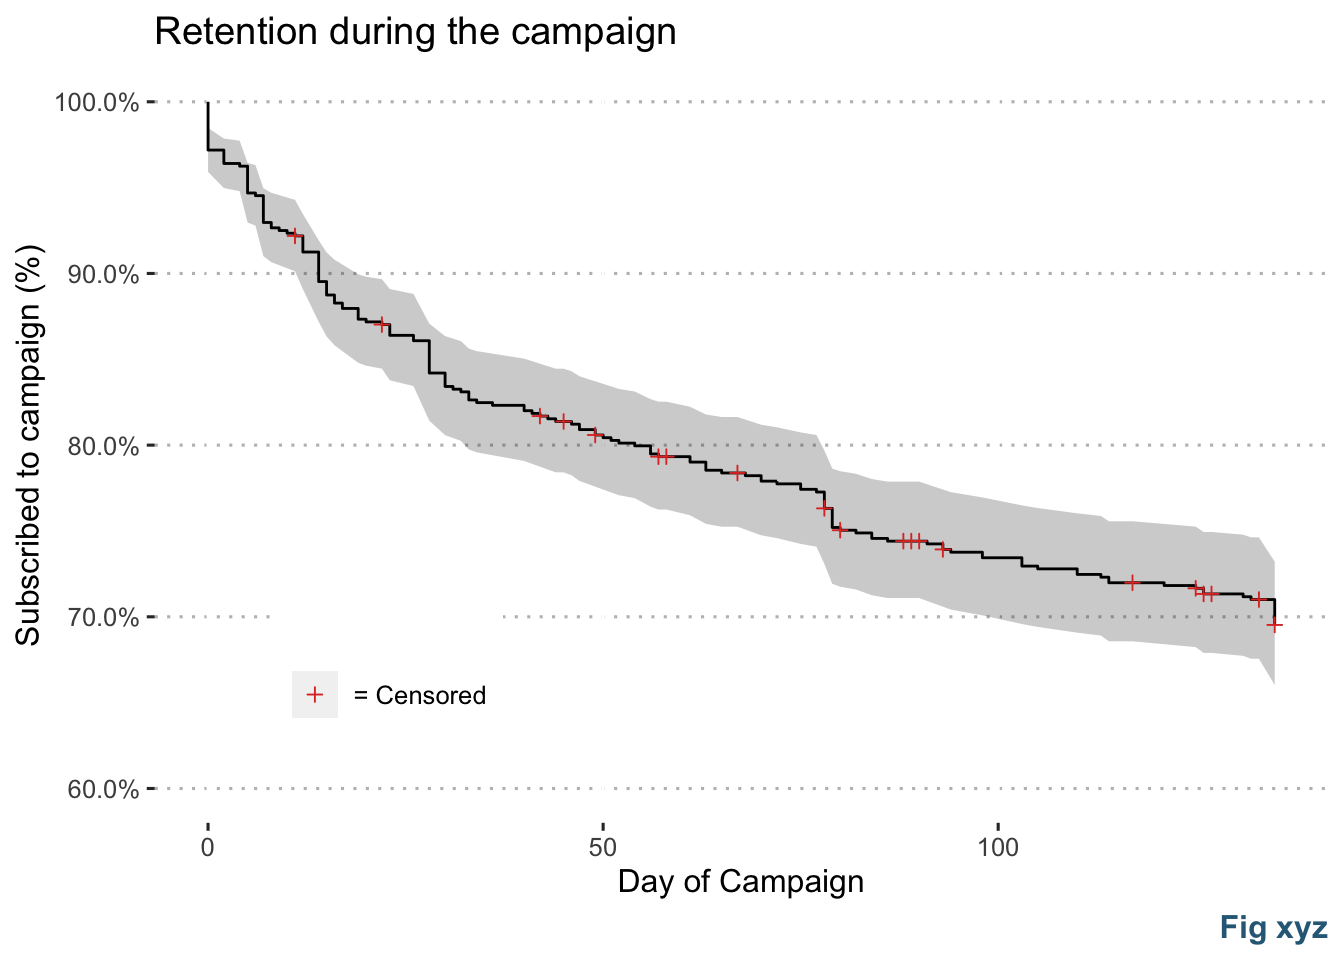
# # Autoplot
# survfit(survObj ~ 1, data = users) %>%
#   ggsurvplot(data = users)
rm(SurvPlot, dat, dat.cens, survObj)
Demographics
Demographic <- "race" # gender, grade, race
df <- semi_join(users, select(HRTC, userID)) %>%
  count(!!sym(Demographic)) %>%
  filter(!is.na(!!sym(Demographic)))

numFactors <- dim(count(df, !!sym(Demographic)))[1]
if(Demographic=="gender") pal <- suppressWarnings(RColorBrewer::brewer.pal(numFactors, "Set1"))
if(Demographic=="grade") pal <- suppressWarnings(RColorBrewer::brewer.pal(numFactors, "Spectral"))
if(Demographic=="race") pal <- suppressWarnings(RColorBrewer::brewer.pal(numFactors, "Dark2"))


waf_data <- df$n
names(waf_data) <- df$race
waf_data %>% waffle(legend_pos="bottom", flip=F, colors=pal)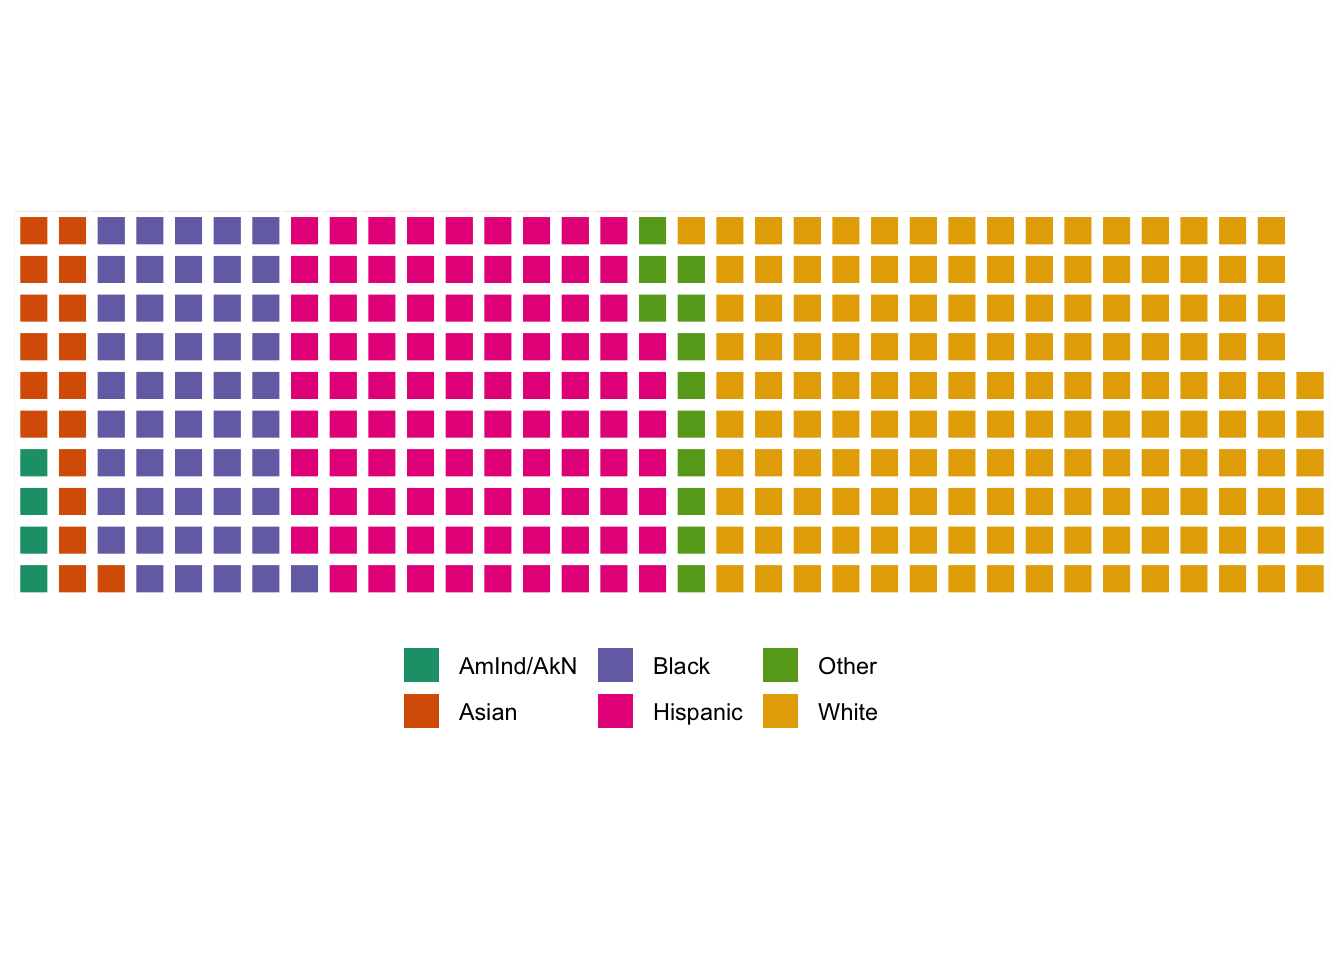
rm(Demographic, numFactors, pal)Response to message style
actual <- HRTC %>%
  mutate(
    Type = recode(Type, "Fact"="Fact/Hotline"),
    Type = recode(Type, "Hotline"="Fact/Hotline")
    ) %>%
  mutate(Replied = as.character(Replied)) %>%
  mutate(Type = ifelse(campg.day==26, "MORE", Type)) %>%
  mutate(
    Replied = recode(Replied, "0"="No"),
    Replied = recode(Replied, "1"="Yes")
    ) %>%
  count(campg.day, Type, Replied, mid) %>%
  spread(Replied, n) %>%
  group_by(Type, campg.day, mid) %>%
  summarise(Yes = sum(Yes, na.rm=T), No=sum(No, na.rm=T)) %>%
  mutate(
    `Reply %` = Yes/(Yes+No),
    n         = Yes + No
  )

actual %>%
  ggplot(aes(x=campg.day, y=`Reply %`, color=Type)) +
  # geom_col(aes(fill=Type)) +
  # geom_step() +
  geom_point() + geom_smooth(aes(fill=Type)) +
  facet_wrap("Type") +
  theme_pubclean() +
  theme(legend.position="bottom") +
  scale_y_continuous(labels=percent, limits = c(0,0.5), oob=scales::squish) +
  scale_color_manual(values=color_guide, name="Style") +
  scale_fill_manual(values=color_guide, name="Style") +

  labs(x="Days into campaign", y="Responded (%)")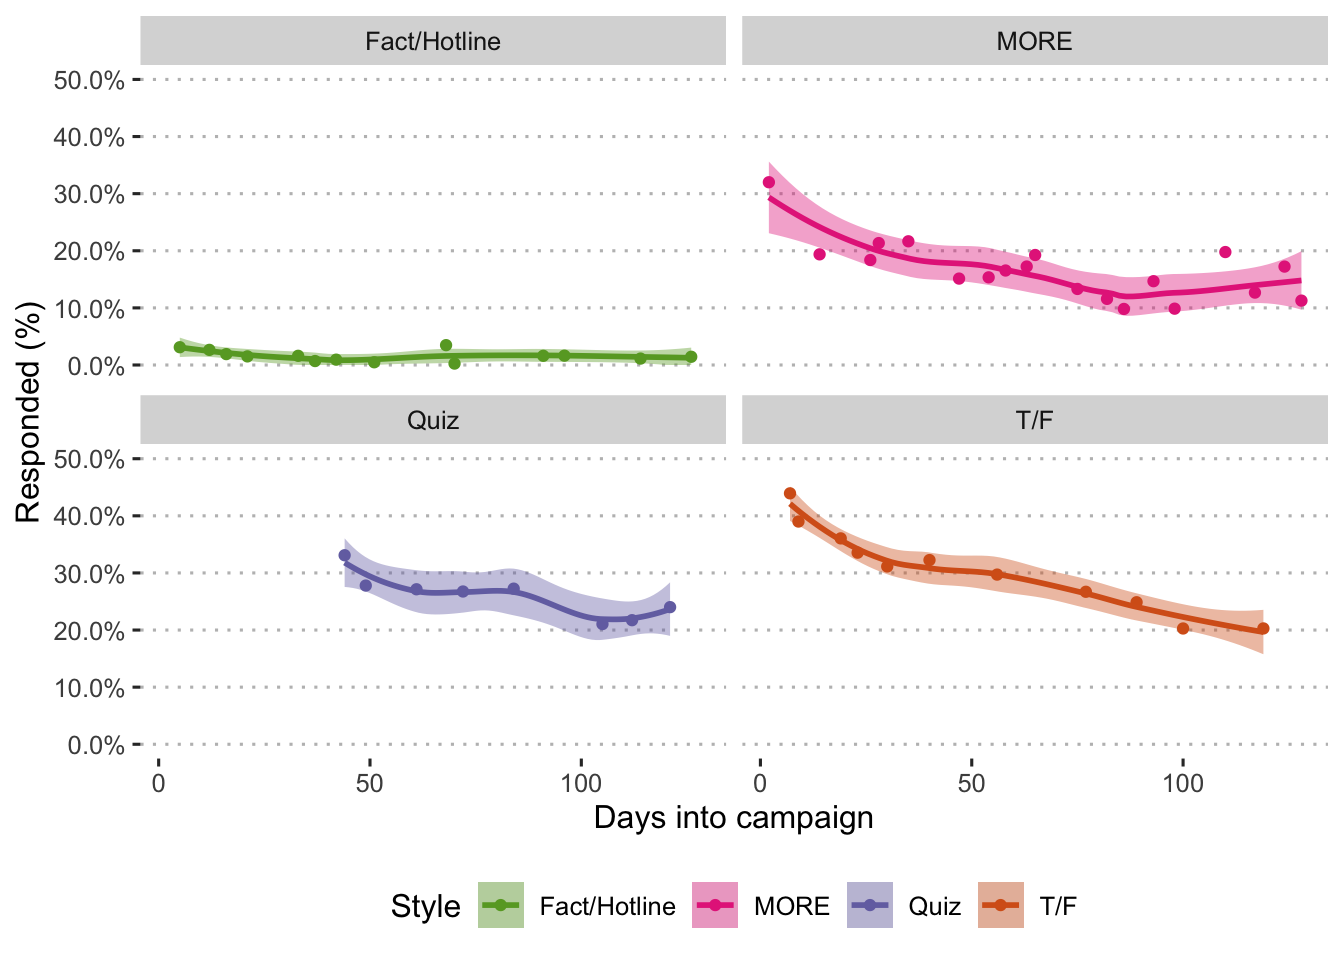
dfModel <- HRTC %>%
  filter(userResponses>0) %>%
  mutate(Dummy = as.factor(zipcode)) %>%
  mutate(userID = as.factor(userID)) %>%
  mutate(Category = as.factor(Category)) %>%
  mutate(Replied = ifelse(Replied==1, "Yes", "No")) %>%
  mutate(Replied = factor(Replied, levels=c("No","Yes")))

mod <- glm(Replied ~ Type + userResponses + campg.num,
           data=dfModel, family=binomial(link = "logit"))

newDf <- data.frame(
  userResponses = rep(mean(dfModel$userResponses),5),
  campg.num     = rep(mean(dfModel$campg.num),5),
  Type          = unique(dfModel$Type)
)

cbind(newDf, predict(mod, newdata=newDf, type="response", se.fit=TRUE)) %>%
  rename(prob=fit, se.prob=se.fit) %>%
  mutate(
    ll = prob - 1.96*se.prob,
    ul = prob + 1.96*se.prob,
  ) %>%
  ggplot(aes(x=Type, y = prob)) +
  geom_col(aes(fill=Type)) +
  geom_errorbar(aes(ymin = ll, ymax = ul), width = 0.2, lty=1, lwd=1) +
  # geom_point(shape=18, size=3, fill="black") +
  geom_point(aes(x=Type, y=`Reply %`), data=actual) +
  scale_color_discrete(name="Message Style") +
  scale_fill_discrete(name="Message Style") +
  scale_y_continuous(labels=percent) +
  labs(title= " Predicted probabilities", x="Question Type", y="Pr(respond to message)")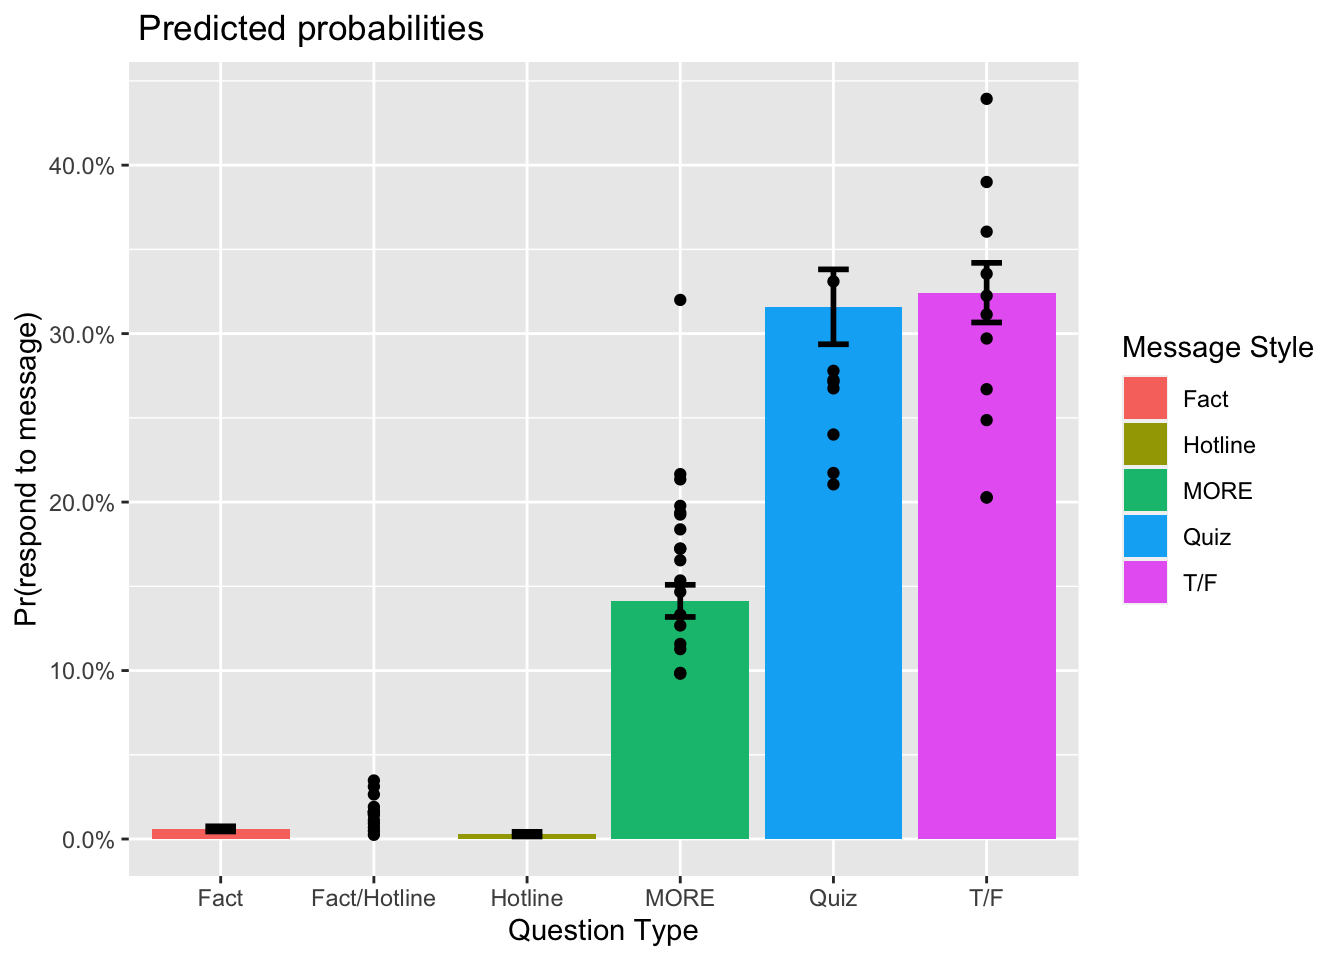
rm(dfModel, mod, newDf)
rm(actual)
Session info
pander(sessionInfo())R version 3.6.3 (2020-02-29)
Platform: x86_64-apple-darwin15.6.0 (64-bit)
locale: en_US.UTF-8||en_US.UTF-8||en_US.UTF-8||C||en_US.UTF-8||en_US.UTF-8
attached base packages: stats, graphics, grDevices, utils, datasets, methods and base
other attached packages: jtools(v.2.0.2), GGally(v.1.4.0), waffle(v.0.7.0), ggrepel(v.0.8.2), pander(v.0.6.3), survMisc(v.0.5.5), survminer(v.0.4.6), ggpubr(v.0.2.5), magrittr(v.1.5), survival(v.3.1-8), lme4(v.1.1-21), Matrix(v.1.2-18), stargazer(v.5.2.2), scales(v.1.1.0), knitr(v.1.28), lubridate(v.1.7.4), forcats(v.0.5.0), stringr(v.1.4.0), dplyr(v.0.8.5), purrr(v.0.3.4), readr(v.1.3.1), tidyr(v.1.1.0), tibble(v.3.0.0), ggplot2(v.3.3.0), tidyverse(v.1.3.0) and MASS(v.7.3-51.5)
loaded via a namespace (and not attached): nlme(v.3.1-144), fs(v.1.4.1), RColorBrewer(v.1.1-2), httr(v.1.4.1), tools(v.3.6.3), backports(v.1.1.6), R6(v.2.4.1), mgcv(v.1.8-31), DBI(v.1.1.0), colorspace(v.1.4-1), withr(v.2.1.2), tidyselect(v.1.1.0), gridExtra(v.2.3), compiler(v.3.6.3), extrafontdb(v.1.0), cli(v.2.0.2), rvest(v.0.3.5), xml2(v.1.3.0), labeling(v.0.3), bookdown(v.0.18), digest(v.0.6.25), minqa(v.1.2.4), rmarkdown(v.2.1), pkgconfig(v.2.0.3), htmltools(v.0.4.0), extrafont(v.0.17), dbplyr(v.1.4.2), rlang(v.0.4.6), readxl(v.1.3.1), rstudioapi(v.0.11), farver(v.2.0.3), generics(v.0.0.2), zoo(v.1.8-7), jsonlite(v.1.6.1), Rcpp(v.1.0.4.6), munsell(v.0.5.0), fansi(v.0.4.1), lifecycle(v.0.2.0), stringi(v.1.4.6), yaml(v.2.2.1), plyr(v.1.8.6), grid(v.3.6.3), crayon(v.1.3.4), lattice(v.0.20-38), haven(v.2.2.0), splines(v.3.6.3), hms(v.0.5.3), pillar(v.1.4.3), boot(v.1.3-24), ggsignif(v.0.6.0), reprex(v.0.3.0), glue(v.1.4.0), evaluate(v.0.14), blogdown(v.0.18), data.table(v.1.12.8), modelr(v.0.1.6), vctrs(v.0.3.0), nloptr(v.1.2.2.1), Rttf2pt1(v.1.3.8), cellranger(v.1.1.0), gtable(v.0.3.0), reshape(v.0.8.8), km.ci(v.0.5-2), assertthat(v.0.2.1), xfun(v.0.13), xtable(v.1.8-4), broom(v.0.5.5), KMsurv(v.0.1-5) and ellipsis(v.0.3.0)