Quick note: The data here excludes subjects with a documented bacterial infections
Response variables & distributions
The two response variables we’re interested in are the duration of time they were on antibiotics (ABX) and their length of stay (LOS). To begin, we’ll explore both of these in the two figures below:
Plotting our response variables
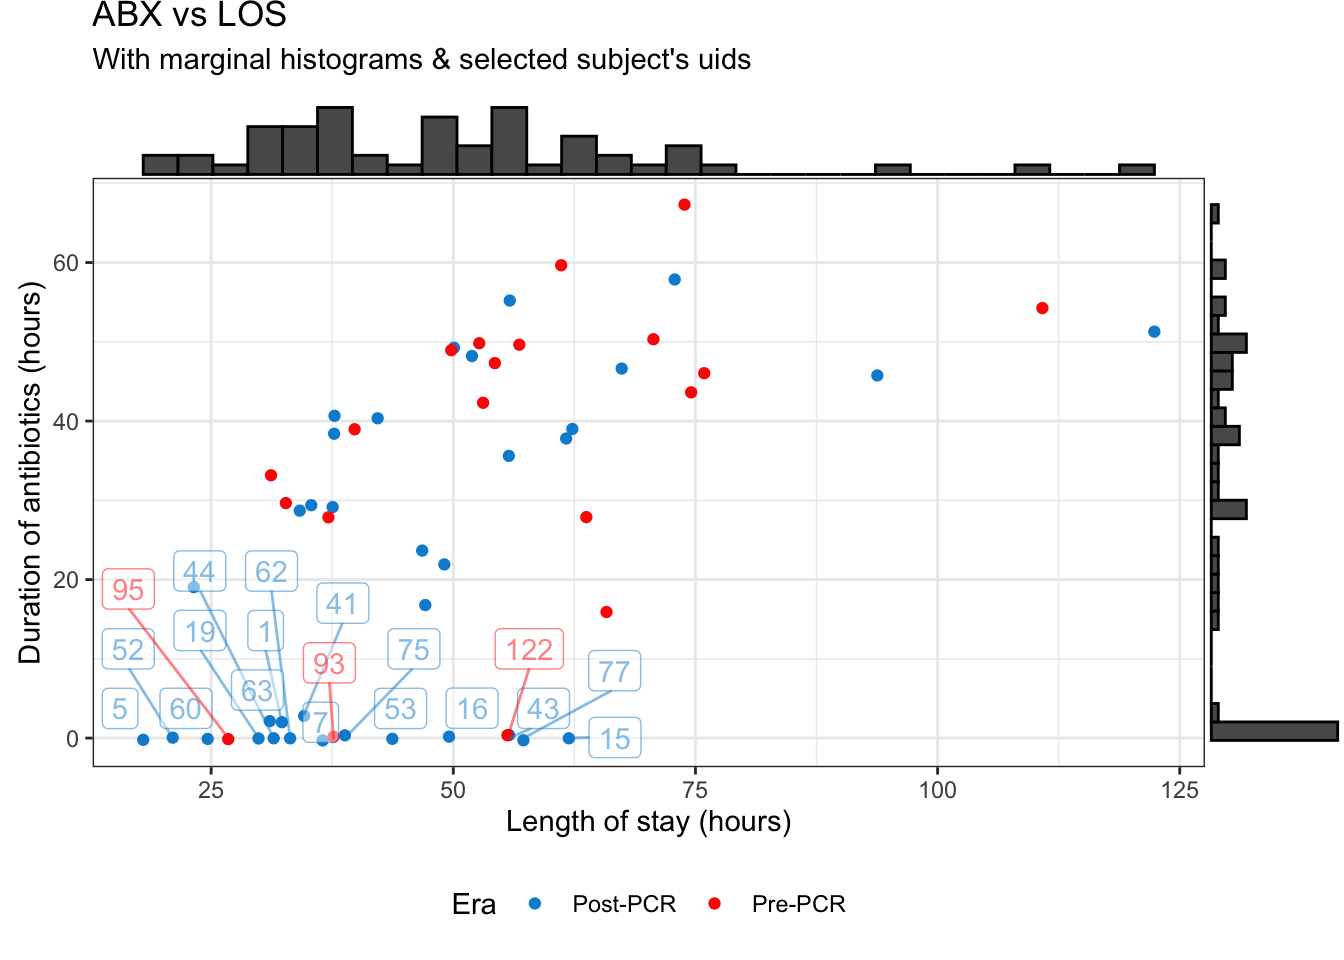
Figure 1: Antibiotic duration vs length of stay
The marginal histograms can be further broken down by their PCR era below:
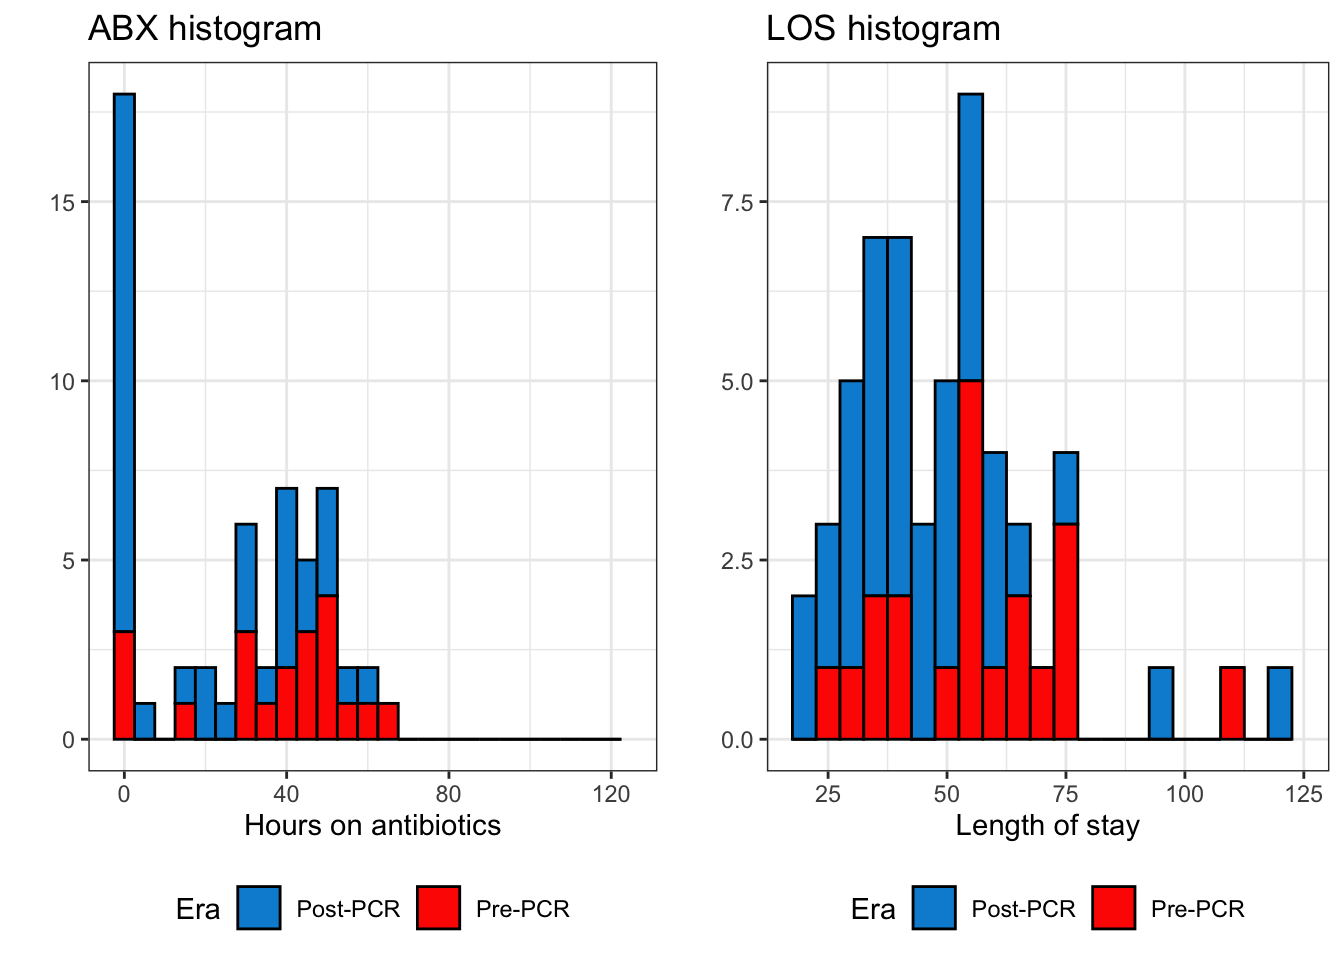
Figure 2: Histogram of duration on antibiotics and length of stay
Distribution
The LOS looks pretty good, but we have an large cluster of patients who had zero hours of antibiotics (ABX) regardless of how long their LOS was. On one hand this is actually good news, since we have an unexpectedly large number of subjects in the Post-PCR era who had zero hours of antibiotics.
But while this might be good for stewardship, this presents a bit of a problem for me in modeling the data. As shown in figure 2, the distribution of ABX is bimodal, with a peak at zero and a peak farther out around ~40 hours. This means our model needs to account for why some folks didn’t get any antibiotics (regardless of PCR era) and other folks did.
To make matters even more complicated, the distributions of ABX between the Pre-PCR and Post-PCR eras aren’t the same (figure 3, below). Again, this is good because it indicates the PCR is having an effect on stewardship, but could mean that we’ll have unequal variance in our models.
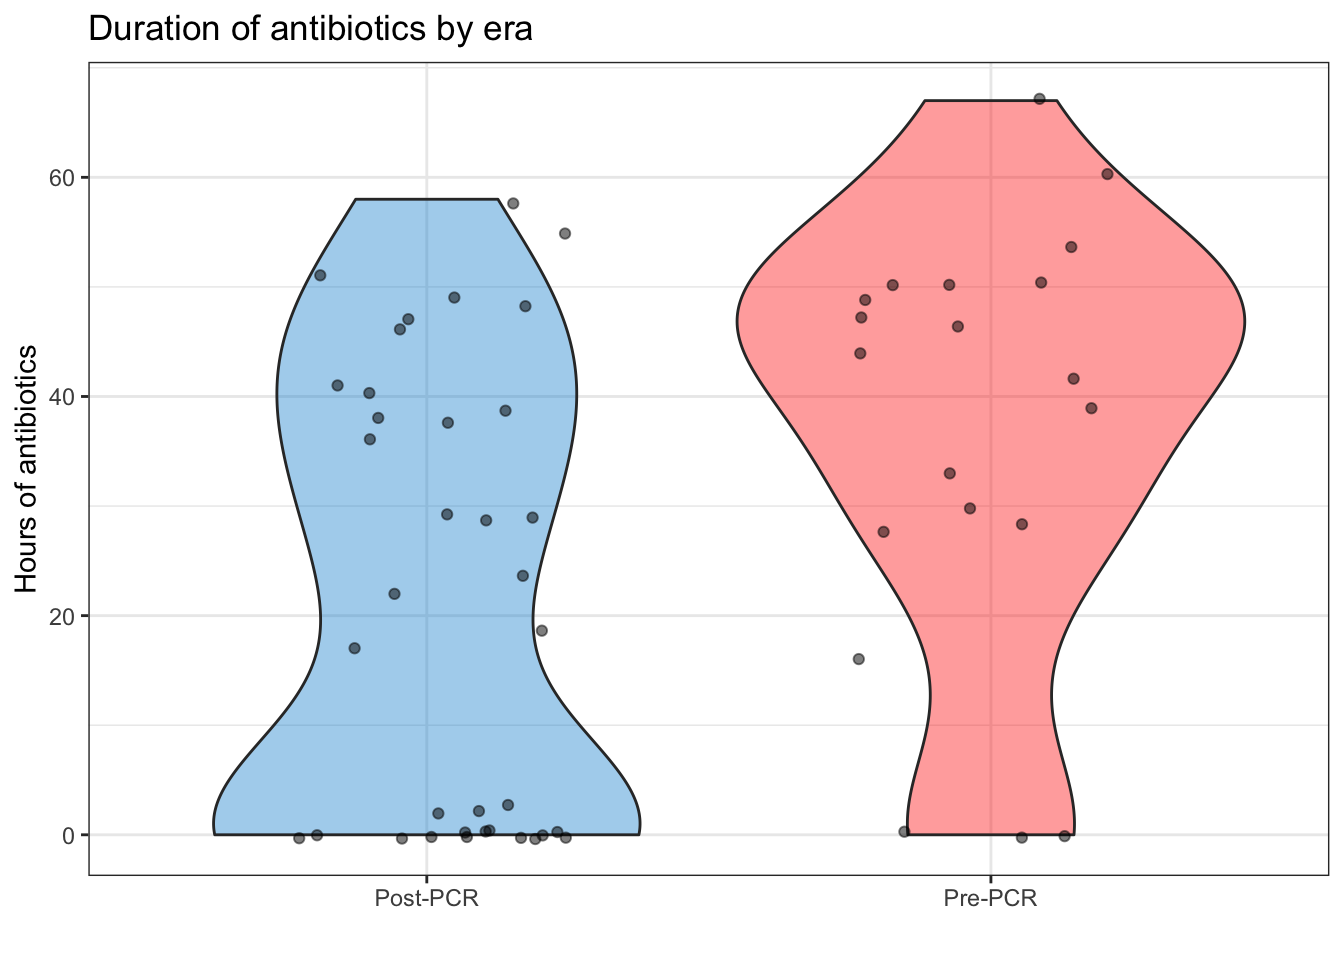
Figure 3: Violin plot of antibiotic duration, split by era
For what it’s worth, accounting for the PCR era alone doesn’t fix the distribution. This can be illustrated by the QQ plot of the model: \(Y_{i} = \beta_{0} + \beta_{1}\ {\sf PCR\ era}_{i} + \epsilon_{i}\)
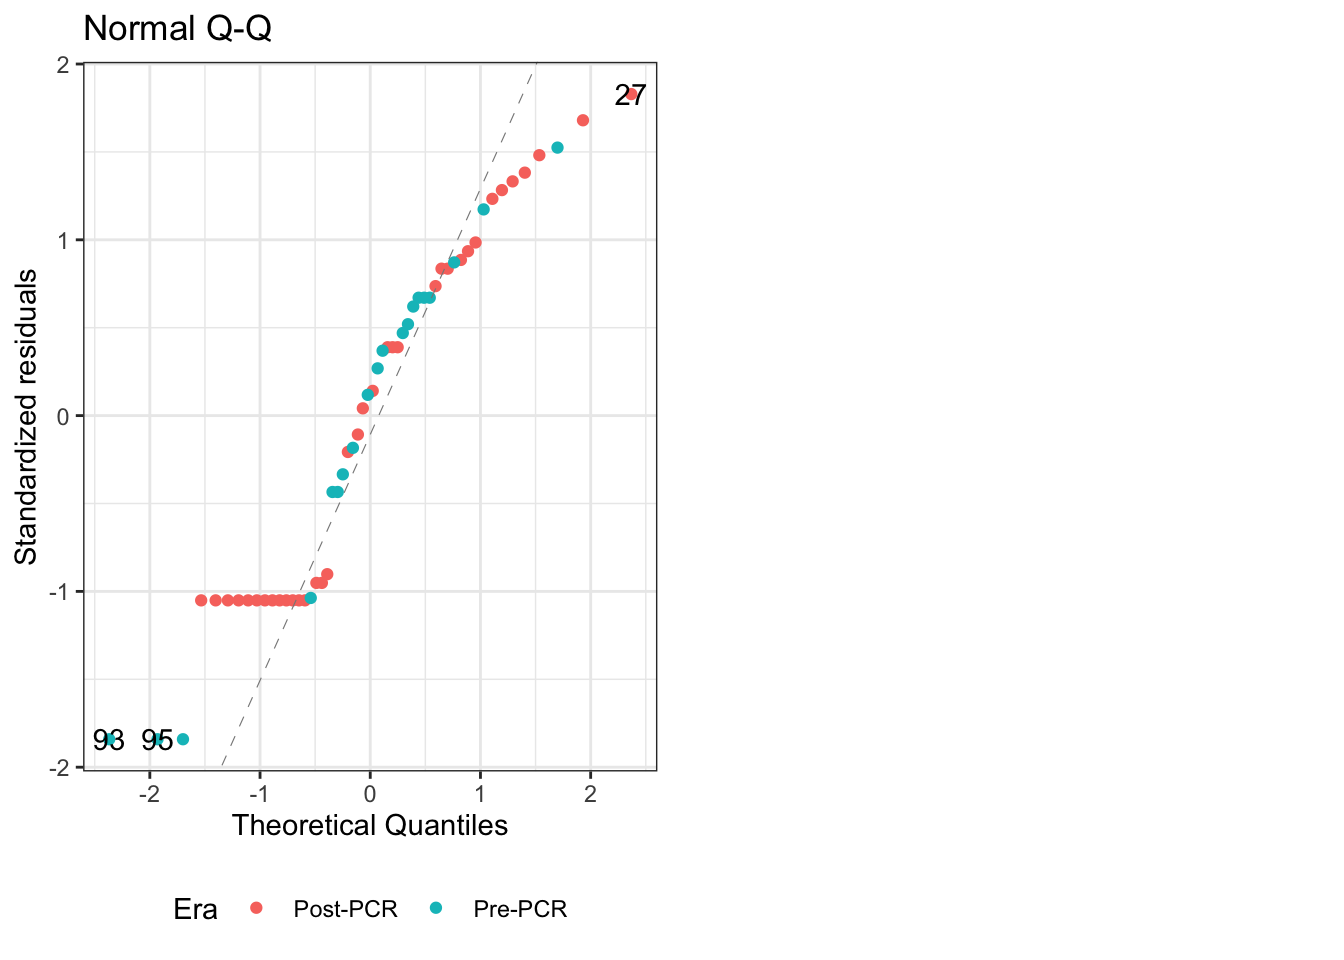
Figure 4: QQ plot for linear model of PCR era alone
The QQ plot shows that it’s not normally distributed, and is strongly light-tailed1.
Balanced data
Additionally, our data is not balanced, which means that the factorial ANOVA is less resistant to violations of the assumptions of the normality2. This means for our models we’ll have to use a type II or III sums of squares in our model. This can be seen below by tallying the data (see column n).
| Era | n | Mean LOS | LOS sd | Mean ABX | ABX sd |
|---|---|---|---|---|---|
| Post-PCR | 36 | 46.79 | 20.5 | 21.17 | 20.79 |
| Pre-PCR | 20 | 56.2 | 19.86 | 36.65 | 19.74 |
And this problem only worsens as you stratify by additional predictors in the model. For my referance, this Cross Validated post explains the difference among these methods well, and this paper outlines the pros/cons on each type3.
Additionally, here’s a blog post showing how to easily change them in R. This post shows how to use the contrast car::contr.Sum().
Modeling Antibiotic Duration
After doing some exploratory analysis, I identified a few key predictors of antibiotic duration. The table below shows the outputs of three linear models (of antibiotics duration) that I made with these predictors. The model #1 just shows the PCR era, with the referance being the pre-PCR era (the same as used in the QQ plot above).
Model #2 adds in the subject’s diagnosis4, with viral infection being the referance. This is illustrated by the equation below, with \({\sf X}_{1}\) representing the PCR era and \({\sf X}_{2}\) representing their diagnosis. \(\beta_{3}\) is the interaction of these two terms, and is not shown in the regression table
\[{\sf Model\ 2:}\ \ \ \hat{Y} = \beta_{0} + \beta_{1}{\sf X}_{1} + \beta_{2}{\sf X}_{2} + \beta_{3}{\sf X}_{1}{\sf X}_{2} + \epsilon\] Model #3 adds a thrid term indicating if they got a LP, with the referance being true (meaning that they did get an LP).
| Duration of ABX | |||
| mod1 | mod2 | mod3 | |
| Era[S.Post-PCR] | -7.742** (-13.324, -2.159) | -7.439* (-14.051, -.827) | -6.525* (-11.584, -1.466) |
| LP_Done[S.FALSE] | -10.257** (-16.701, -3.813) | ||
| Infxn[S.FUO] | 13.818* (3.007, 24.628) | 10.995* (.445, 21.545) | |
| Infxn[S.NonInfxn] | -6.599 (-15.847, 2.648) | -2.829 (-11.437, 5.778) | |
| Constant | 28.908*** (23.326, 34.491) | 33.516*** (26.904, 40.128) | 32.294*** (25.851, 38.738) |
| Observations | 56 | 56 | 56 |
| R2 | .120 | .235 | .423 |
| Adjusted R2 | .104 | .159 | .338 |
| Residual Std. Error | 20.425 (df = 54) | 19.791 (df = 50) | 17.552 (df = 48) |
| F Statistic | 7.388** (df = 1; 54) | 3.076* (df = 5; 50) | 5.018*** (df = 7; 48) |
| Notes: | *P < .05 | ||
| **P < .01 | |||
| ***P < .001 | |||
Addressing those who got zero hours of ABX
The models above do a pretty good job, but they all have an intercept that is highly signifigant. We know that this is not the case in reality, as there are a number of subjects who got zero hours of antibiotics (see figure 2). So we shall try to account for why some of these patients didn’t get any antibiotics, while some others did get antibiotics.
Factors associated with no ABX
In figure 5 and 6, we can see that Tmax and Age are both associated with not receiving any antibiotics (illustrated by the density plots), but not strongly associated with the duration of antibiotics (illustrated by the scatterplots). Specifically, a low Tmax was associated with not getting antibiotics (figure 5) while a young age was associated with getting some antibiotics (figure 6).
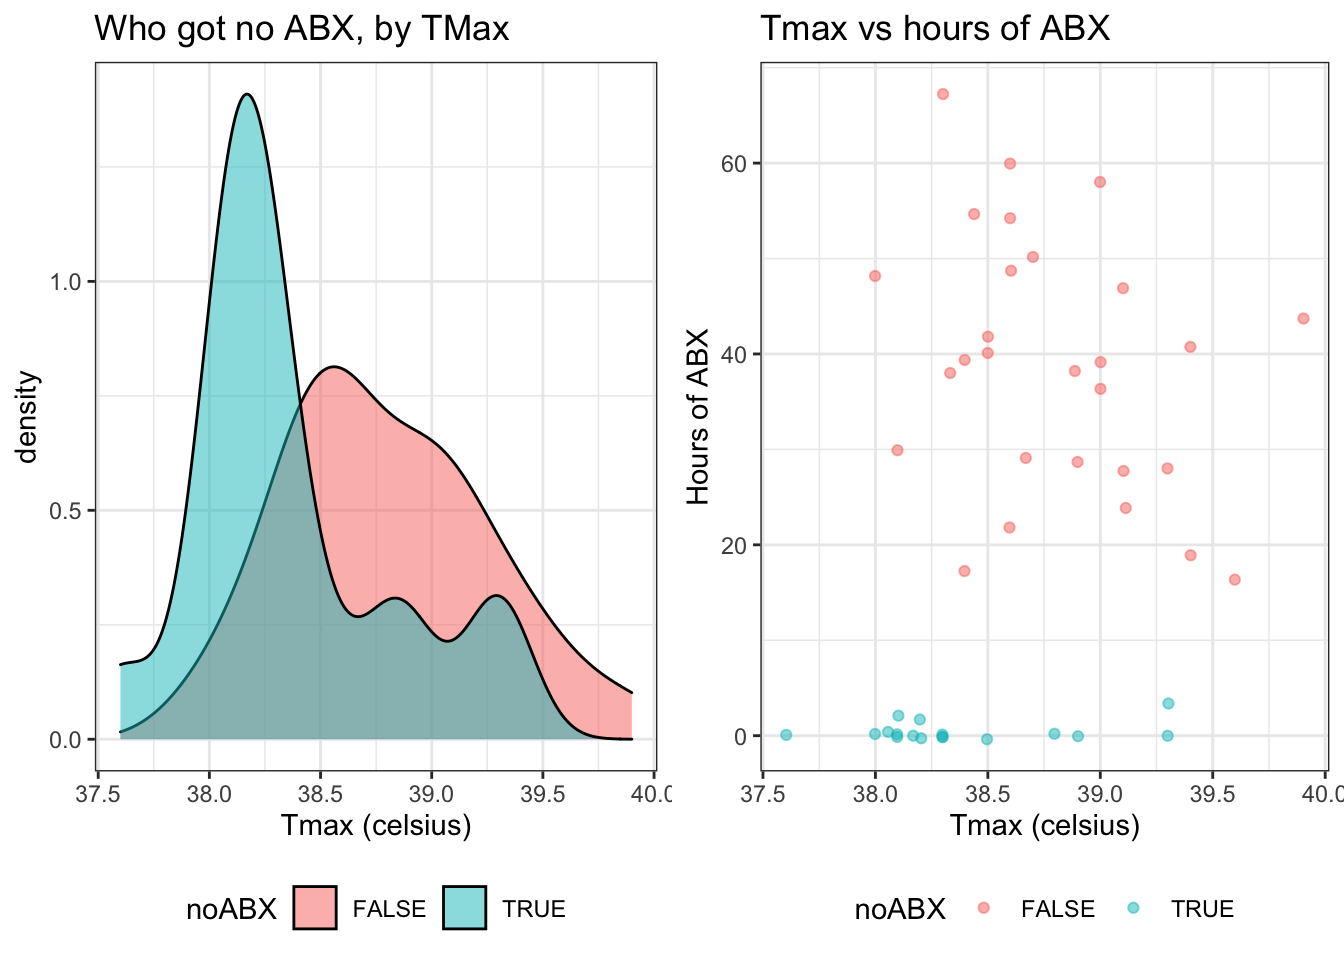
Figure 5: Duration of antibiotics by Tmax
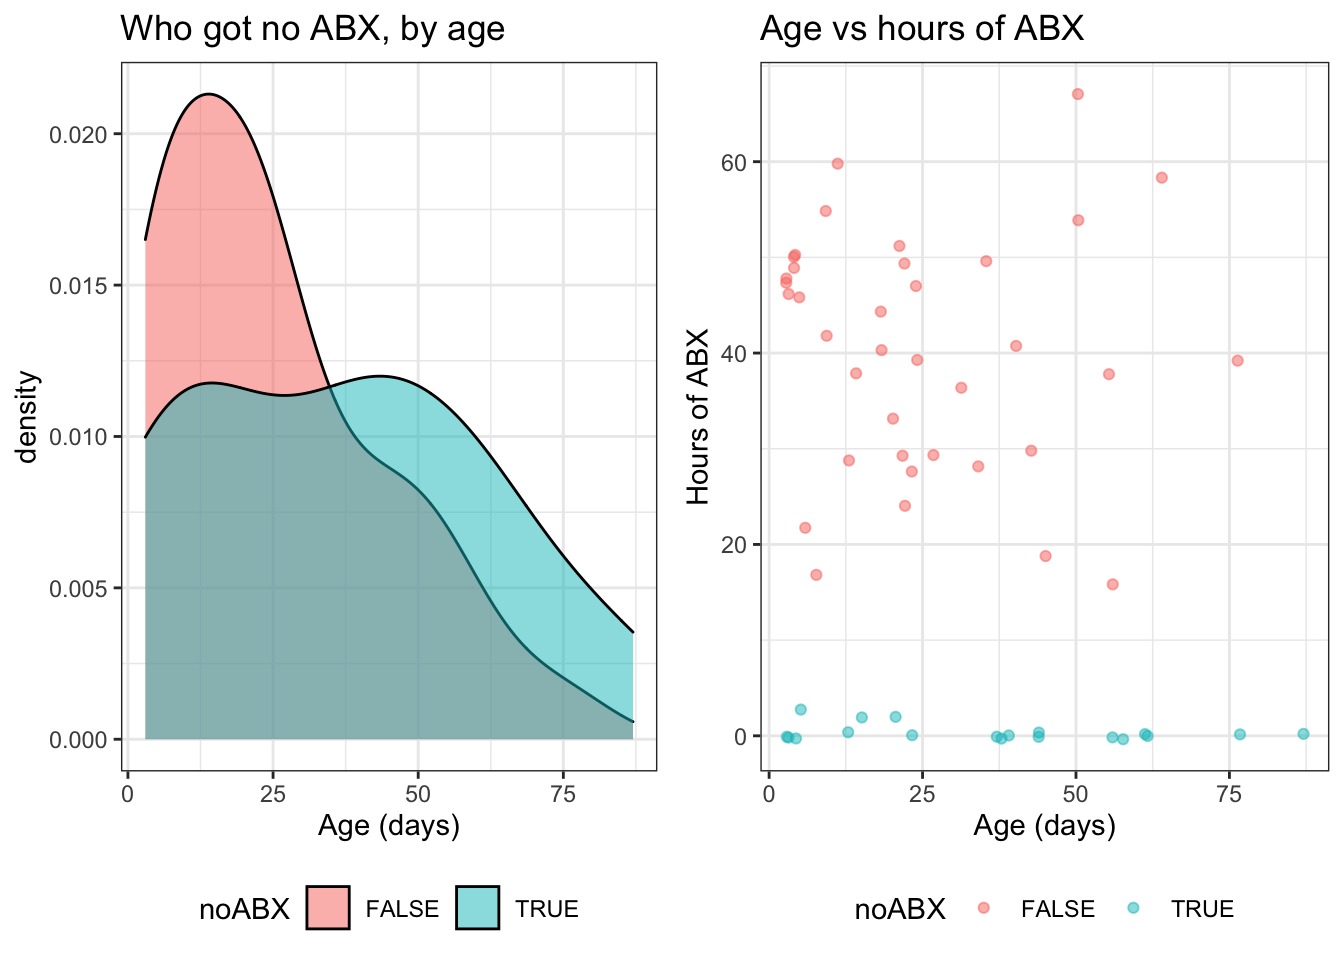
Figure 6: Duration of antibiotics by age
It’s also worth mentioning that in the previous models we had already (partially) accounted for the folks who didn’t get antibiotics when we considered their LP status. Figure 7 illustrates that not getting an LP was associated with not getting any antibiotics.
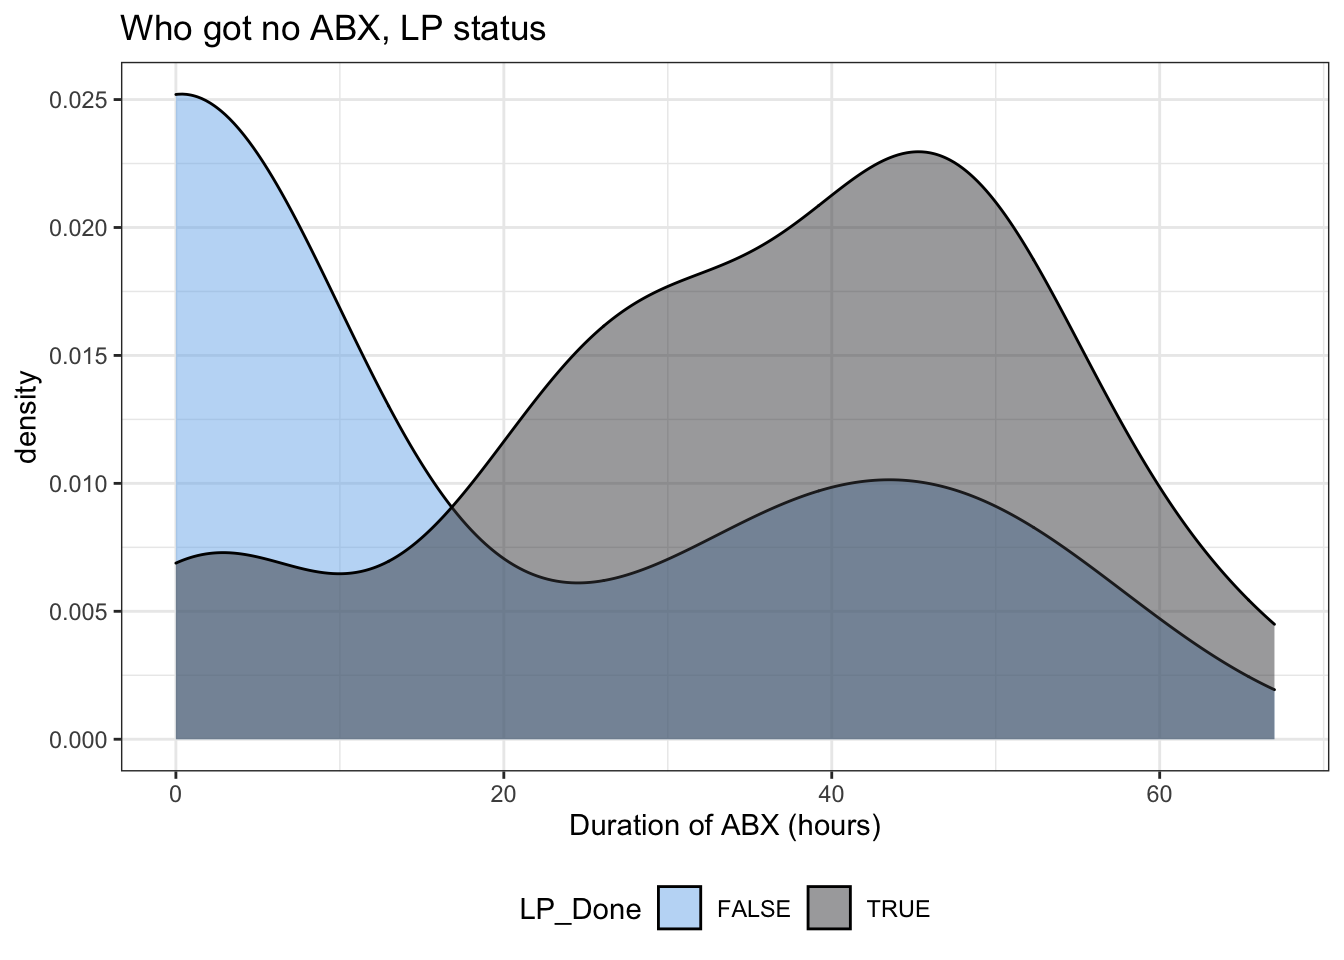
Figure 7: Duration of antibiotics by LP status
Modeling these factors
This model
| Duration of ABX | ||
| mod3 | mod4 | |
| Era[S.Post-PCR] | -6.525* (-11.584, -1.466) | -6.990* (-12.404, -1.577) |
| LP_Done[S.FALSE] | -10.257** (-16.701, -3.813) | 1.443 (-9.669, 12.556) |
| Infxn[S.FUO]:tMax | -9.353 (-32.378, 13.671) | |
| Infxn[S.NonInfxn]:tMax | 6.589 (-15.595, 28.773) | |
| age:LP_Done[S.FALSE] | -.247 (-.520, .027) | |
| Infxn[S.FUO] | 10.995* (.445, 21.545) | 379.273 (-507.231, 1,265.776) |
| Infxn[S.NonInfxn] | -2.829 (-11.437, 5.778) | -271.572 (-1,125.004, 581.861) |
| Era[S.Post-PCR]:LP_Done[S.FALSE] | -.716 (-5.774, 4.343) | |
| LP_Done[S.FALSE]:Infxn[S.FUO] | 1.708 (-8.842, 12.258) | |
| LP_Done[S.FALSE]:Infxn[S.NonInfxn] | -4.317 (-12.924, 4.291) | |
| tMax | 3.209 (-11.582, 18.000) | |
| age | .035 (-.237, .307) | |
| Constant | 32.294*** (25.851, 38.738) | -97.085 (-663.982, 469.812) |
| Observations | 56 | 45 |
| R2 | .423 | .537 |
| Adjusted R2 | .338 | .417 |
| Residual Std. Error | 17.552 (df = 48) | 16.496 (df = 35) |
| F Statistic | 5.018*** (df = 7; 48) | 4.502*** (df = 9; 35) |
| Notes: | *P < .05 | |
| **P < .01 | ||
| ***P < .001 | ||
Other models
ABX ~ Era + Infxn + LP_Done + age
| Duration of ABX | |
| Era[S.Post-PCR] | -5.891* |
| (-10.994, -.788) | |
| LP_Done[S.FALSE] | -1.465 |
| (-11.566, 8.636) | |
| Infxn[S.FUO] | 21.957* |
| (5.171, 38.743) | |
| Infxn[S.NonInfxn] | -5.287 |
| (-18.709, 8.134) | |
| age | .362 |
| (-.129, .853) | |
| Constant | 37.805*** |
| (27.704, 47.906) | |
| Observations | 56 |
| R2 | .516 |
| Adjusted R2 | .366 |
| Residual Std. Error | 17.185 (df = 42) |
| F Statistic | 3.440** (df = 13; 42) |
| Notes: | *P < .05 |
| **P < .01 | |
| ***P < .001 | |
Model diagnostics: This model is great (as far as the Adjusted \(R^2\) is concerned), but is problematic because it has a singularity on LP_DoneTRUE:InfxnViral:age
Good reference over on Cross Validated for QQ plot interpretation↩
this is a subject of much debate, but type III is the most conservative as it only calcualtes the marginal effects and doesn’t care about the sample size of each anova square↩
Diagnosis are categorized into viral infection, FUO, non-infectious↩
Hunter Ratliff, MD, MPH
Infectious Diseases Fellow
My research interests include epidemiology, social determinants of health, and reproducible research.