If you want to cut to the chase, the results presented for the abstract can be found here, along with their tables and figures. This page also details the methods for the length of stay (LOS) and duration of therapy (DOT) models.
Prep work
Missing data imputation
Similar to before, we don’t have much missing data, with only a few patients missing gestational age and birth weight
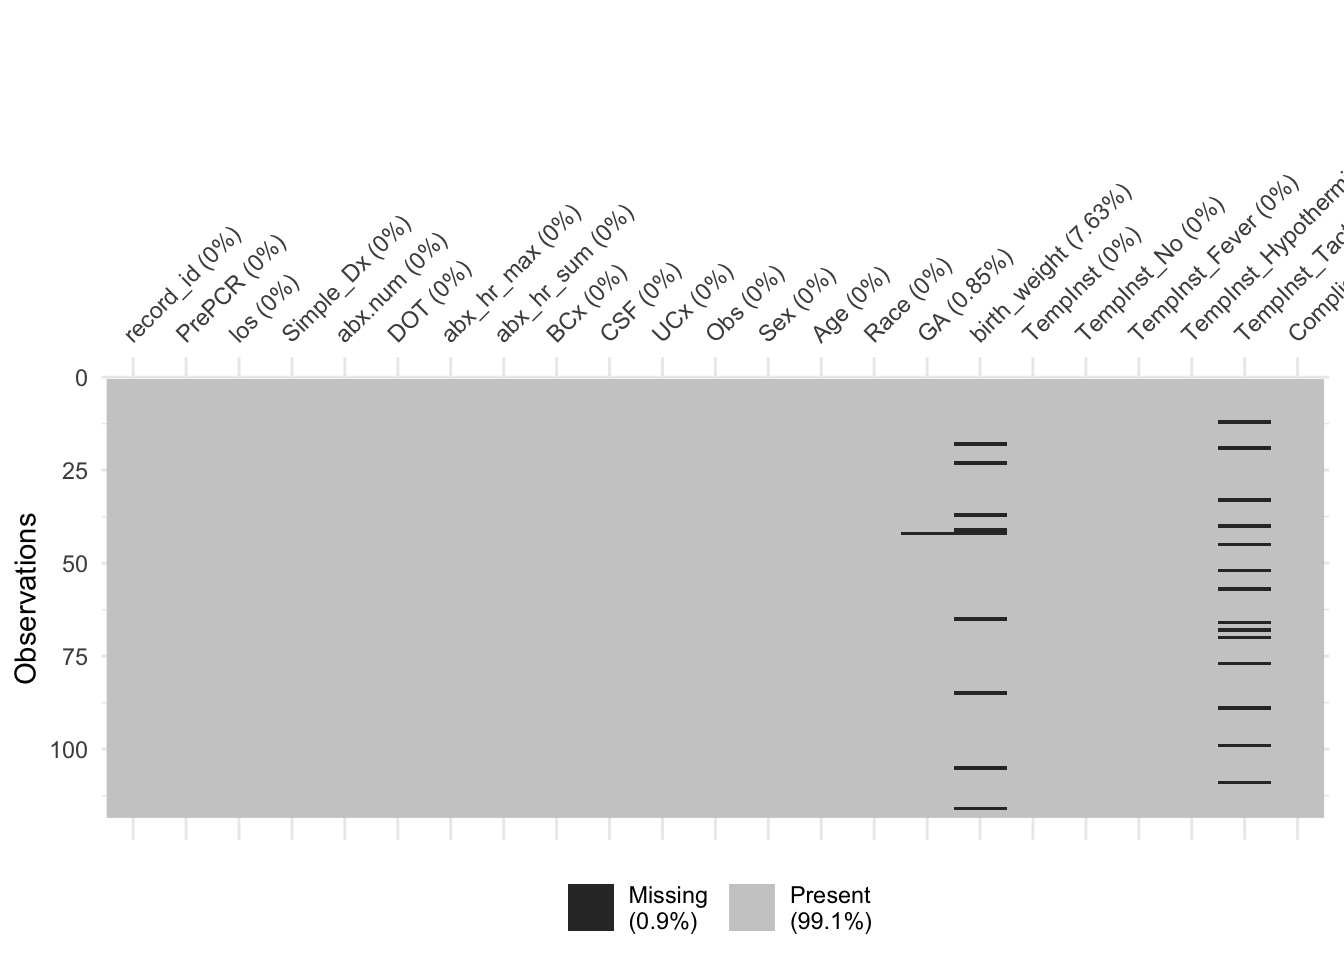
We’ll impute those now
Defining categories
First, we’ll collapse Race into larger categories, since we really have 3 common races recorded (including a large “other” group). Therefore, any race that shows up fewer than 10 times will be lumped together with “Other”. We’ll also recode BCx to where CONS is considered “other” like the other contaminants
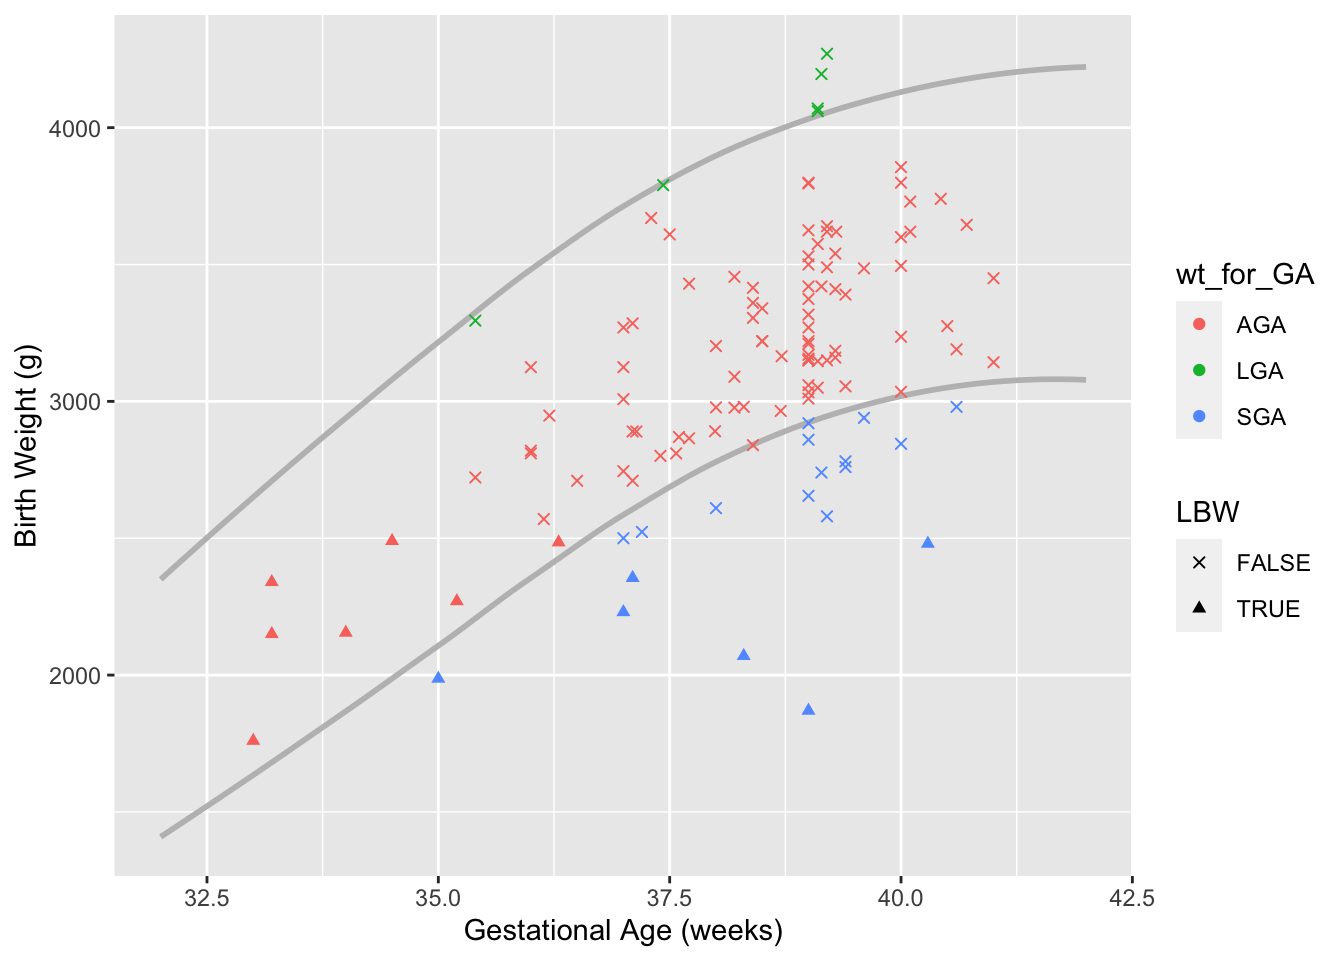
Next we make a new wt_for_GA category that compares the patients gestational age & weight to the national Z-scores. Data comes from Talge et al., 2014, and uses less than the 10th percentile for SGA and greater than the 90th percentile for LGA. Because so few patients are LGA, this category is combined with AGA. We’ll also make categories for LBW (less than 2500 gram, regardless of GA) and prematurity (GA < 37).
Descriptive Statitics
This is the basic Table 1 for our results, showing descriptive statistics of included patients stratified by era
| Table 1 | Era: Post-PCR (N = 66) | Era: Pre-PCR (N = 52) |
|---|---|---|
| los | ||
| Mean (95% CI) | 47.63 (42.57 - 52.69) | 56.00 (50.93 - 61.07) |
| Median (IQR) | 46.9 (32.6, 55.8) | 56.1 (46.1, 68.3) |
| Range | 12.8 to 122.4 | 14.2 to 110.8 |
| DOT | ||
| Mean (95% CI) | 23.69 (18.63 - 28.74) | 56.50 (43.85 - 69.16) |
| Median (IQR) | 26.6 (0.0, 43.3) | 48.0 (15.2, 93.2) |
| Range | 0 to 59.7 | 0 to 158 |
| Diagnosis | ||
| FUO | 26 (39.4%) | 19 (36.5%) |
| Viral | 40 (60.6%) | 33 (63.5%) |
| TempInst | ||
| Both | 0 (0.0%) | 1 (1.9%) |
| ERROR | 0 (0.0%) | 1 (1.9%) |
| Fever | 54 (81.8%) | 40 (76.9%) |
| Hypothermia | 11 (16.7%) | 7 (13.5%) |
| None | 1 (1.5%) | 3 (5.8%) |
| Sex | ||
| Female | 31 (47.0%) | 19 (36.5%) |
| Male | 35 (53.0%) | 33 (63.5%) |
| Age | ||
| Mean (95% CI) | 28.44 (23.00 - 33.87) | 31.08 (25.18 - 36.98) |
| Median (IQR) | 22.0 (7.2, 44.8) | 29.0 (11.0, 50.0) |
| Range | 2 to 87 | 2 to 76 |
| GA | ||
| Mean (95% CI) | 38.33 (37.90 - 38.75) | 38.30 (37.90 - 38.71) |
| Median (IQR) | 39.0 (37.6, 39.1) | 39.0 (37.2, 39.2) |
| Range | 33 to 41 | 34.5 to 40.6 |
| birth_weight | ||
| Mean (95% CI) | 3,086.05 (2,963.15 - 3,208.94) | 3,133.96 (3,009.84 - 3,258.08) |
| Median (IQR) | 3,153.0 (2,812.5, 3,417.5) | 3,136.0 (2,855.0, 3,462.8) |
| Range | 1760 to 4196 | 2070 to 4270 |
| Race | ||
| Black | 8 (12.1%) | 12 (23.1%) |
| White | 47 (71.2%) | 26 (50.0%) |
| Other | 11 (16.7%) | 14 (26.9%) |
| wt_for_GA | ||
| AGA | 57 (86.4%) | 42 (80.8%) |
| SGA | 9 (13.6%) | 10 (19.2%) |
| LBW | ||
| LBW | 8 (12.1%) | 5 (9.6%) |
| prematurity | ||
| Premature | 8 (12.1%) | 8 (15.4%) |
| Term | 58 (87.9%) | 44 (84.6%) |
| Resp_PCR | ||
| Pre-PCR | 0 (0.0%) | 52 (100.0%) |
| negative | 19 (28.8%) | 0 (0.0%) |
| Not Done | 18 (27.3%) | 0 (0.0%) |
| Virus | 29 (43.9%) | 0 (0.0%) |
| CSF_PCR | ||
| negative | 22 (33.3%) | 0 (0.0%) |
| Not Done | 32 (48.5%) | 0 (0.0%) |
| Pre_PCR | 0 (0.0%) | 52 (100.0%) |
| Virus | 12 (18.2%) | 0 (0.0%) |
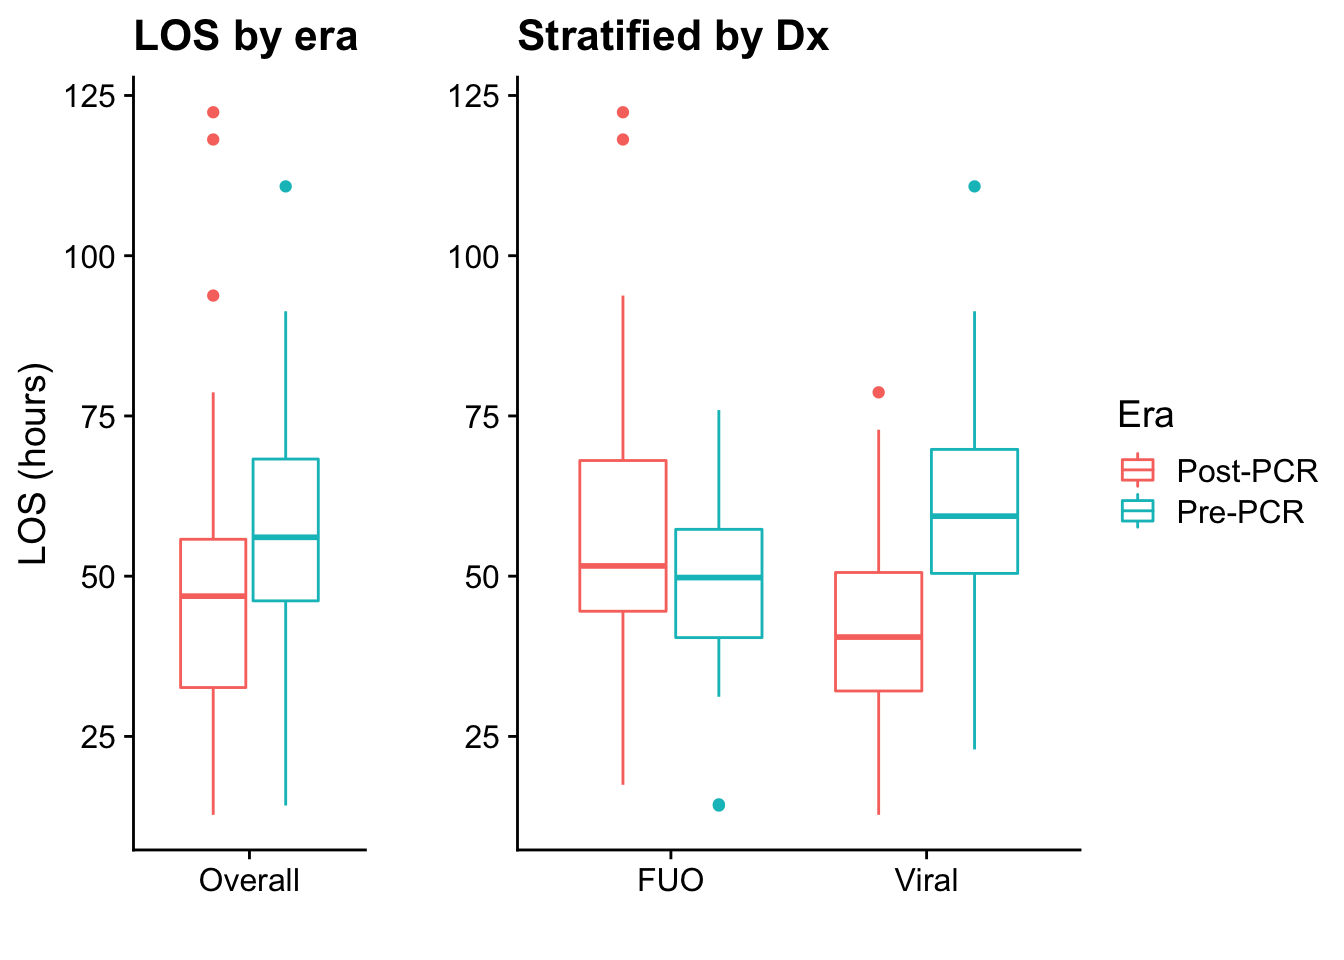
Table 2 shows results for the PCR era only, comparing the simplified diagnosis with results of the PCRs
| Table 2 | Diagnosis: FUO (N = 26) | Diagnosis: Viral (N = 40) |
|---|---|---|
| Resp_PCR | ||
| Pre-PCR | 0 (0.0%) | 0 (0.0%) |
| negative | 13 (50.0%) | 6 (15.0%) |
| Not Done | 12 (46.2%) | 6 (15.0%) |
| Virus | 1 (3.8%) | 28 (70.0%) |
| CSF_PCR | ||
| negative | 13 (50.0%) | 9 (22.5%) |
| Not Done | 13 (50.0%) | 19 (47.5%) |
| Virus | 0 (0.0%) | 12 (30.0%) |
Length of Stay
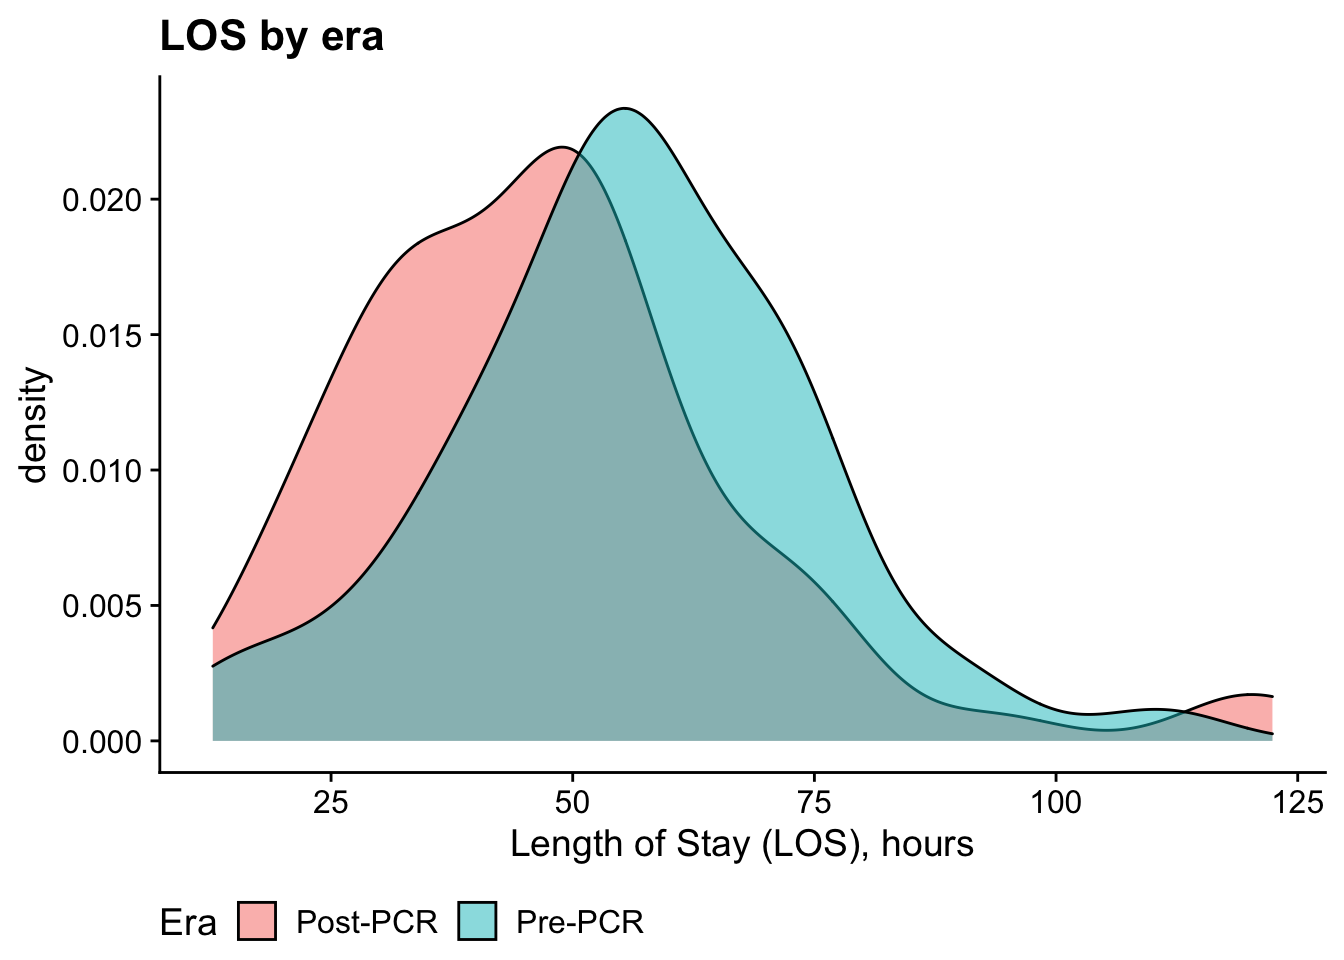
Bivariate analysis: t-test
| Test statistic | df | P value | Alternative hypothesis |
|---|---|---|---|
| -2.29 | 114.3 | 0.02384 * | two.sided |
| mean in group Post-PCR | mean in group Pre-PCR |
|---|---|
| 47.63 | 56 |
DOT
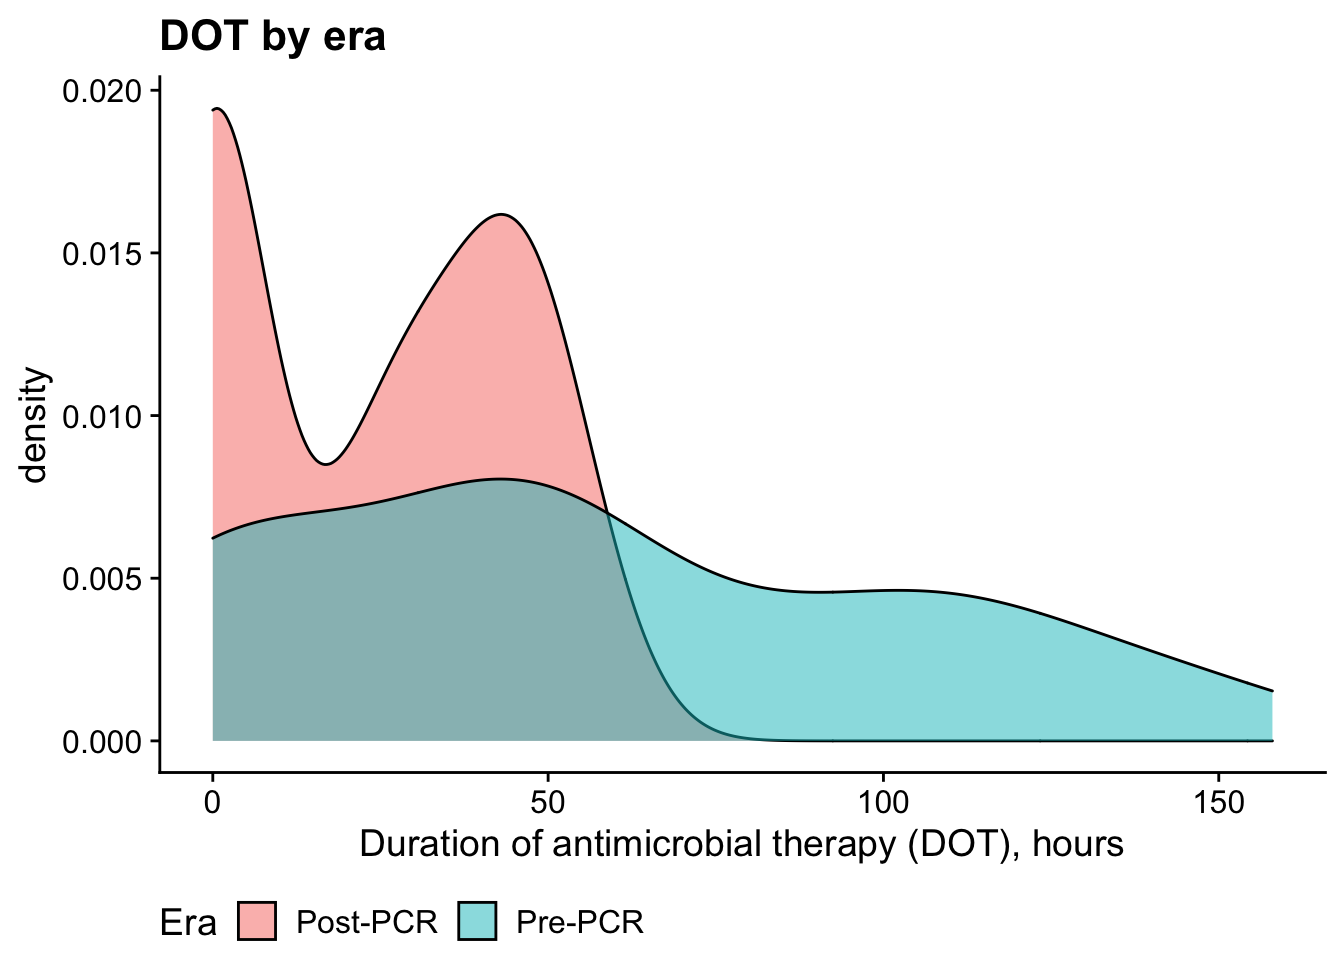
Bivariate analysis: Mann-Whitney U Test (nonparametric d/t non-normality)
| Test statistic | P value | Alternative hypothesis |
|---|---|---|
| 1025 | 0.0001539 * * * | two.sided |
| difference in location |
|---|
| -28 |
Excluded patients
Here’s a summary of how many patients were included/excluded:
| Patient status | n |
|---|---|
| Included | 118 |
| Those admitted with a known infection/focal infection or later diagnosed with bacterial infection | 38 |
| No sepsis evaluation done or not concerned for sepsis on admission | 13 |
| Age out of range | 9 |
| Multiple reasons | 8 |
| Those with underlying medical condition | 4 |
| Duplicate patient | 3 |
| Those requiring admission or transfer to PICU | 3 |
| Inpatient transfer from another unit or OSH or transfer to another hospital | 1 |
Patients with multiple reasons for exclusion are coded as multiple reasons in the table above. If we look at only the 79 excluded patients, here are their non-mutually exclusive reason(s) for exclusion
| Reasons for exclusion | |||
|---|---|---|---|
| # excluded | % of excluded | % of total | |
| (1) Those admitted with a known infection/focal infection or later diagnosed with bacterial infection | 43 | 54.43% | 21.83% |
| (2) Those with underlying medical condition | 10 | 12.66% | 5.08% |
| (3) Those requiring admission or transfer to PICU | 3 | 3.80% | 1.52% |
| (4) Inpatient transfer from another unit or OSH or transfer to another hospital | 4 | 5.06% | 2.03% |
| (6) No sepsis evaluation done or not concerned for sepsis on admission | 15 | 18.99% | 7.61% |
| (7) Age out of range | 10 | 12.66% | 5.08% |
| (8) Duplicate patient | 4 | 5.06% | 2.03% |
Unfortunately, we don’t have demographics on excluded patients (i.e. age, sex, PCR-era) so we can’t compare them to included patients. Shouldn’t be a problem for the abstract, but should probably be done if this becomes a paper. For what it’s worth, we already have 23 records for excluded patients in RedCap.
Antibiotics
Here’s a quick look at the antibiotic usage over the two eras
| Antibiotic use by Era | ||||||
|---|---|---|---|---|---|---|
| Only antibiotics given during both eras are presented | ||||||
| # patients received | Mean | Median | ||||
| Post-PCR | Pre-PCR | Post-PCR | Pre-PCR | Post-PCR | Pre-PCR | |
| acyclovir | 19 | 13 | 5.96 (2.81 - 9.12) | 8.62 (4.29 - 12.94) | 3.0 | 6.0 |
| ampicillin | 39 | 35 | 35.15 (30.50 - 39.80) | 40.72 (35.36 - 46.08) | 39.0 | 45.0 |
| cefoTAXime | 2 | 26 | 29.00 (-21.96 - 79.96) | 45.45 (39.41 - 51.48) | 29.0 | 47.0 |
| cefTAZidime | 24 | 4 | 34.38 (28.02 - 40.74) | 41.25 (34.59 - 47.91) | 37.5 | 42.5 |
| cefTRIaxone | 15 | 3 | 31.08 (24.35 - 37.81) | 40.67 (11.77 - 69.57) | 31.3 | 39.0 |
| gentamicin | 9 | 9 | 16.10 (2.30 - 29.91) | 43.78 (32.72 - 54.84) | 3.0 | 46.0 |
| none | 21 | 11 | — | — | — | — |
| vancomycin | 4 | 4 | 27.25 (4.33 - 50.17) | 41.75 (14.15 - 69.35) | 25.5 | 50.5 |
Because it looks like we were using different cephalosporins in both eras, here are the results pooling all the cephalosporins together1
| Results for Cephalosporins in the aggregate | |||
|---|---|---|---|
| # patients received | Mean* | Median* | |
| Post-PCR | 40 | 33.73 (29.05 - 38.41) | 35.05 |
| Pre-PCR | 33 | 44.50 (39.21 - 49.80) | 46.00 |
|
*
Calculated from the sum of all cephalosporins for each patient
|
|||
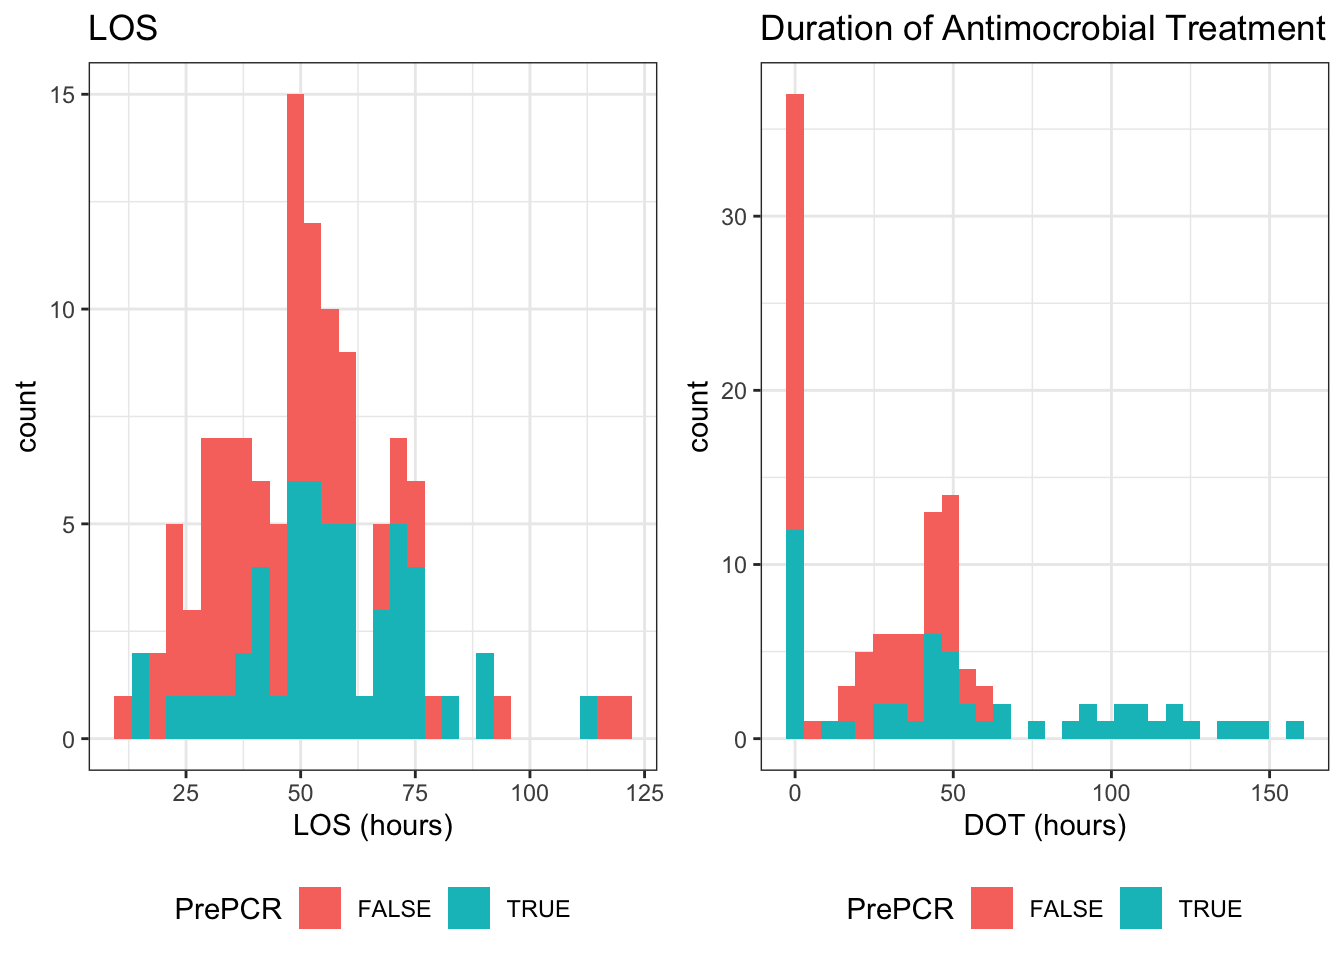
Modeling LOS & DOT
We’ll likely have to take two separate approaches for modeling these, since they follow different distributions. Specifically, DOT is zero inflated while LOS is not
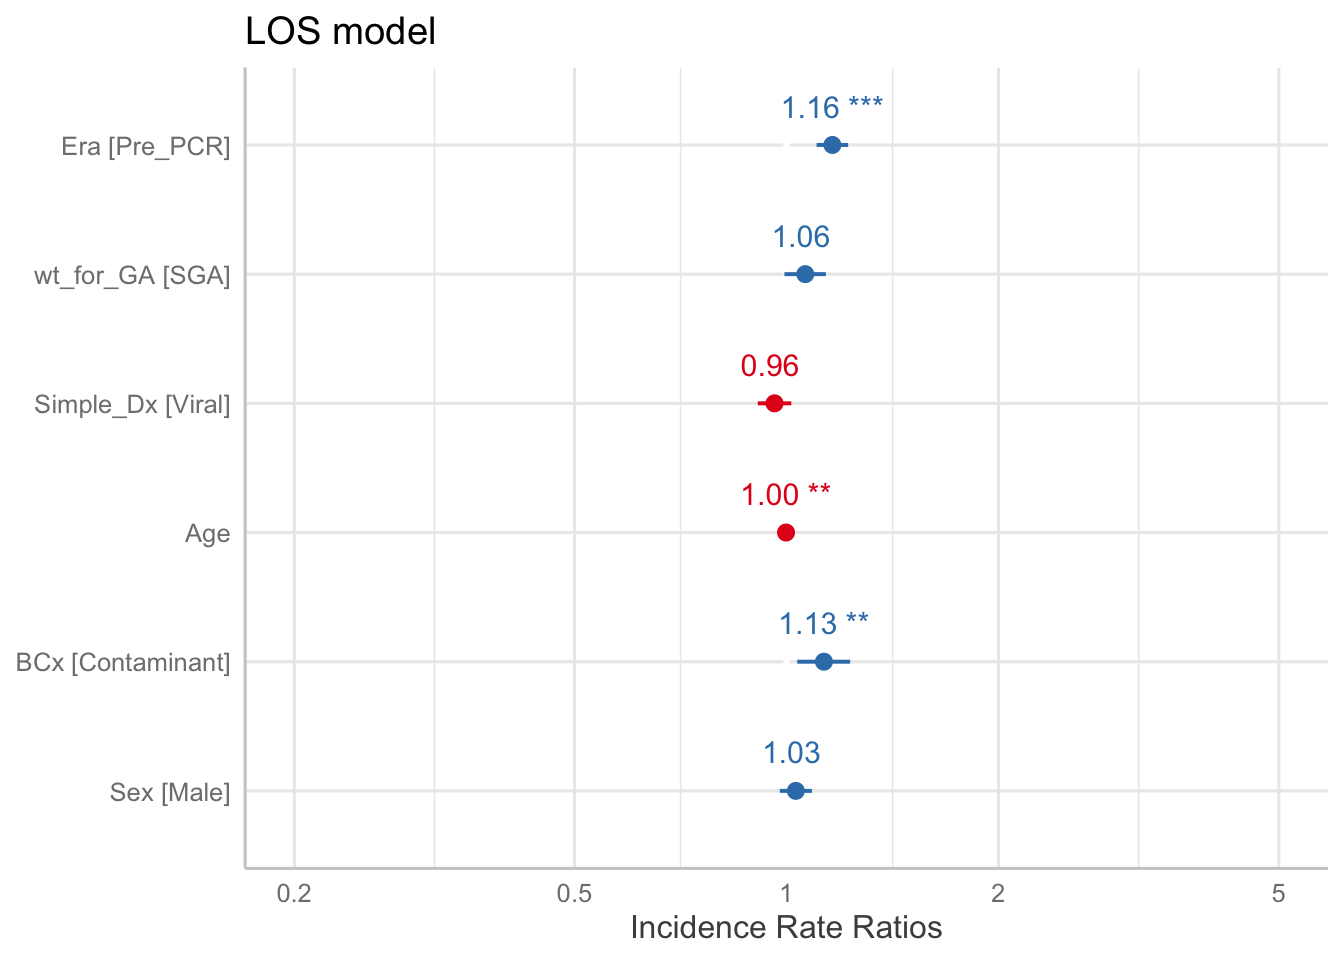
LOS model
LOS is simple, just use a Poisson GLM
| term | IRR | LL | UL | p.value |
|---|---|---|---|---|
| (Intercept) | 49.82 | 41.08 | 60.42 | < 0.001 * |
| EraPre_PCR | 1.162 | 1.02 | 1.33 | 0.027 * |
| wt_for_GASGA | 1.063 | 0.88 | 1.29 | 0.54 |
| Simple_DxViral | 0.9613 | 0.82 | 1.13 | 0.63 |
| Age | 0.9981 | 0.99 | 1 | 0.28 |
| BCxContaminant | 1.13 | 0.92 | 1.39 | 0.25 |
| SexMale | 1.031 | 0.9 | 1.18 | 0.67 |
The table above is transformed to show incidence rate ratio (IRR), which can be thought of as the relative risk2. Thus the coefficient can be thought of as follows:
The LOS was 1.16 times longer in the Pre-PCR era, compared to the Post-PCR era, when adjusting for the above variables
This can be demonstrated by looking at the conditional means in the two eras
| Era | Conditional Mean | conf.low | conf.high |
|---|---|---|---|
| Post-PCR | 49.66 | 46.88 | 52.61 |
| Pre_PCR | 57.68 | 54.71 | 60.81 |
The results of the regression graphically:
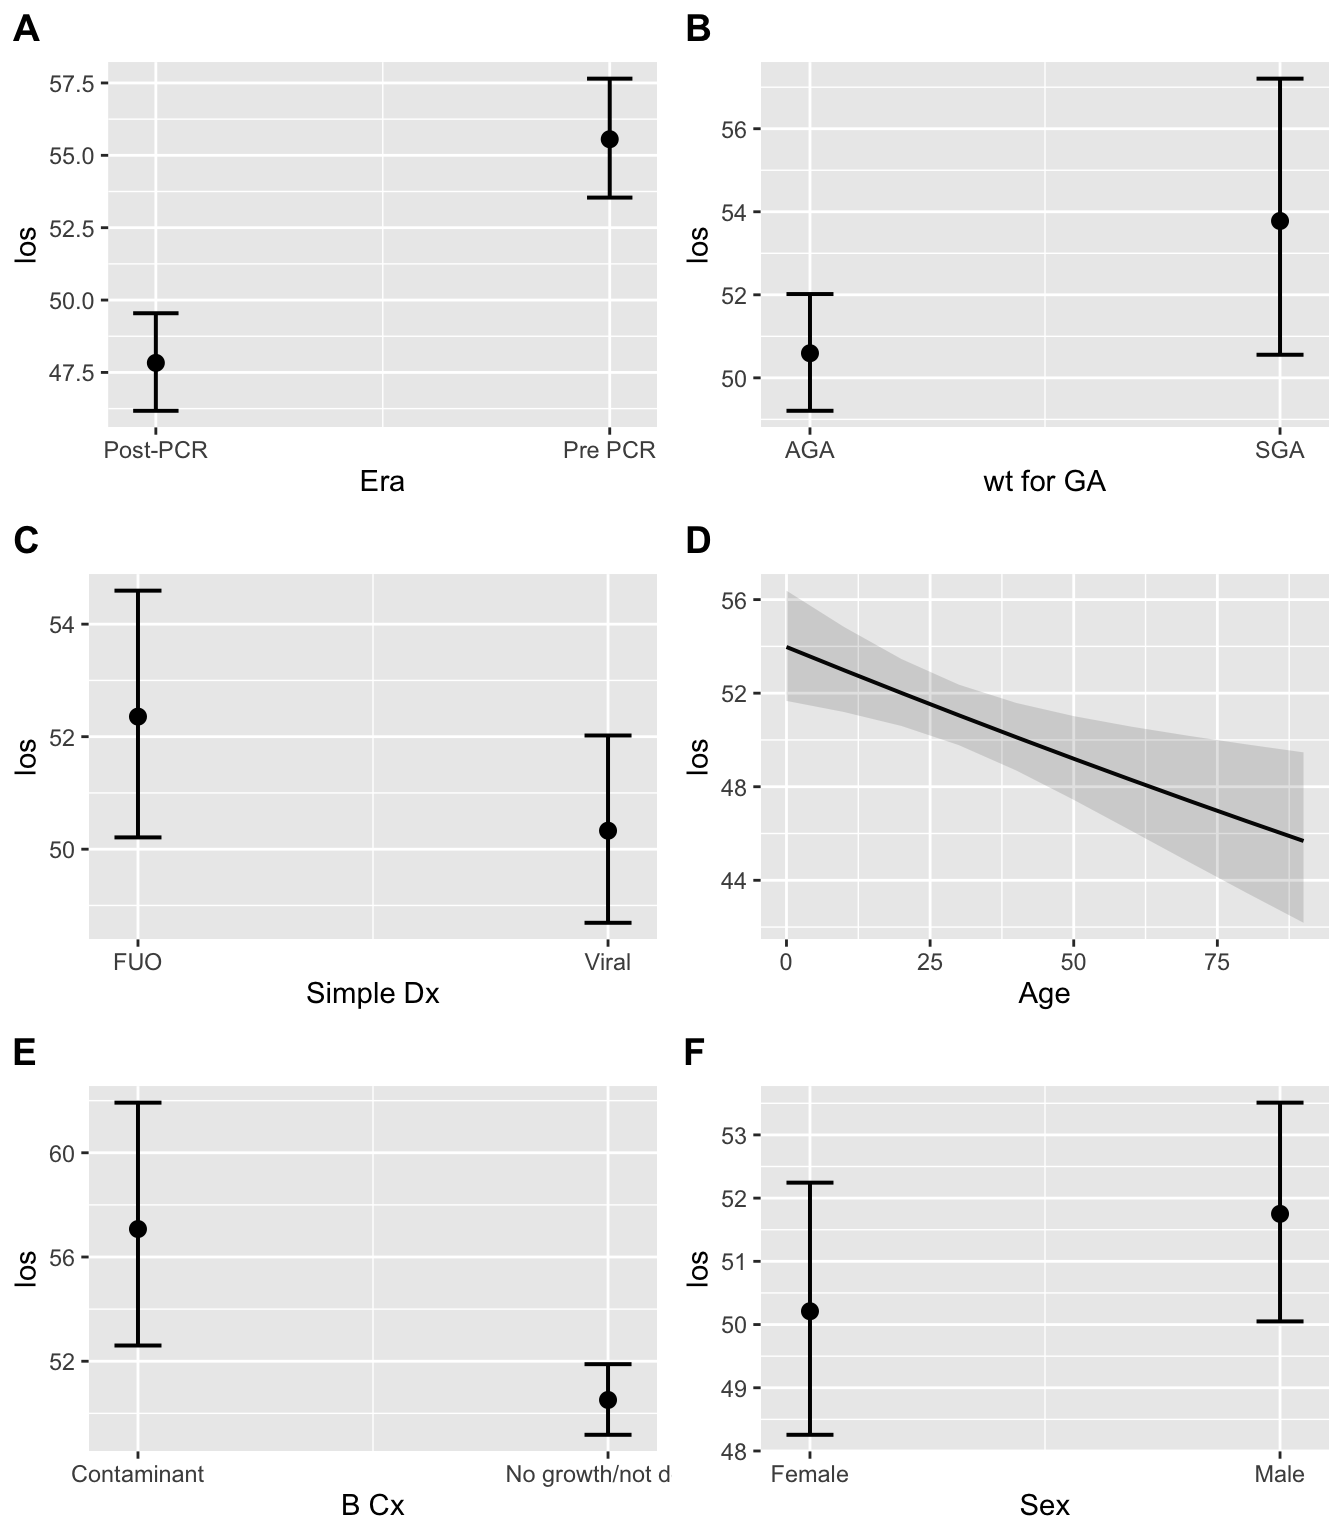
And conditional mean LOS by each covariate:
DOT model
For DOT we have a more complicated picture, since we have lots of zeros3 in the response variable. We’ll use a zero-inflated model, which is kind of a 2-in-1 solution that addresses two questions:
- Who got any antibiotics? Called the zero-inflated model, which is a logistic regression
- Among those who did get antibiotics, how much did they get? Called the conditional model, which works just like to LOS model but is only applied to patients with non-zero DOT’s
Here’s our model:
##  Family: genpois  ( log )
## Formula:          DOT ~ Era + wt_for_GA + Simple_Dx + BCx + Sex
## Zero inflation:       ~Era + wt_for_GA + Simple_Dx + Age
## Data: subj_rounded
##
##      AIC      BIC   logLik deviance df.resid
##    954.9    988.2   -465.5    930.9      106
##
##
## Overdispersion parameter for genpois family (): 19.4
##
## Conditional model:
##                Estimate Std. Error z value Pr(>|z|)
## (Intercept)     3.63194    0.14455  25.125  < 2e-16 ***
## EraPre_PCR      0.66856    0.11776   5.677 1.37e-08 ***
## wt_for_GASGA   -0.06666    0.15094  -0.442  0.65875
## Simple_DxViral -0.25768    0.12196  -2.113  0.03461 *
## BCxContaminant  0.44643    0.16345   2.731  0.00631 **
## SexMale         0.13253    0.11807   1.122  0.26165
## ---
## Signif. codes:  0 '***' 0.001 '**' 0.01 '*' 0.05 '.' 0.1 ' ' 1
##
## Zero-inflation model:
##                Estimate Std. Error z value Pr(>|z|)
## (Intercept)    -1.06751    0.44348  -2.407  0.01608 *
## EraPre_PCR     -0.49930    0.44432  -1.124  0.26112
## wt_for_GASGA   -0.54999    0.63718  -0.863  0.38804
## Simple_DxViral -0.83465    0.46436  -1.797  0.07227 .
## Age             0.02879    0.01012   2.846  0.00443 **
## ---
## Signif. codes:  0 '***' 0.001 '**' 0.01 '*' 0.05 '.' 0.1 ' ' 1
The same results, shown as a figure:
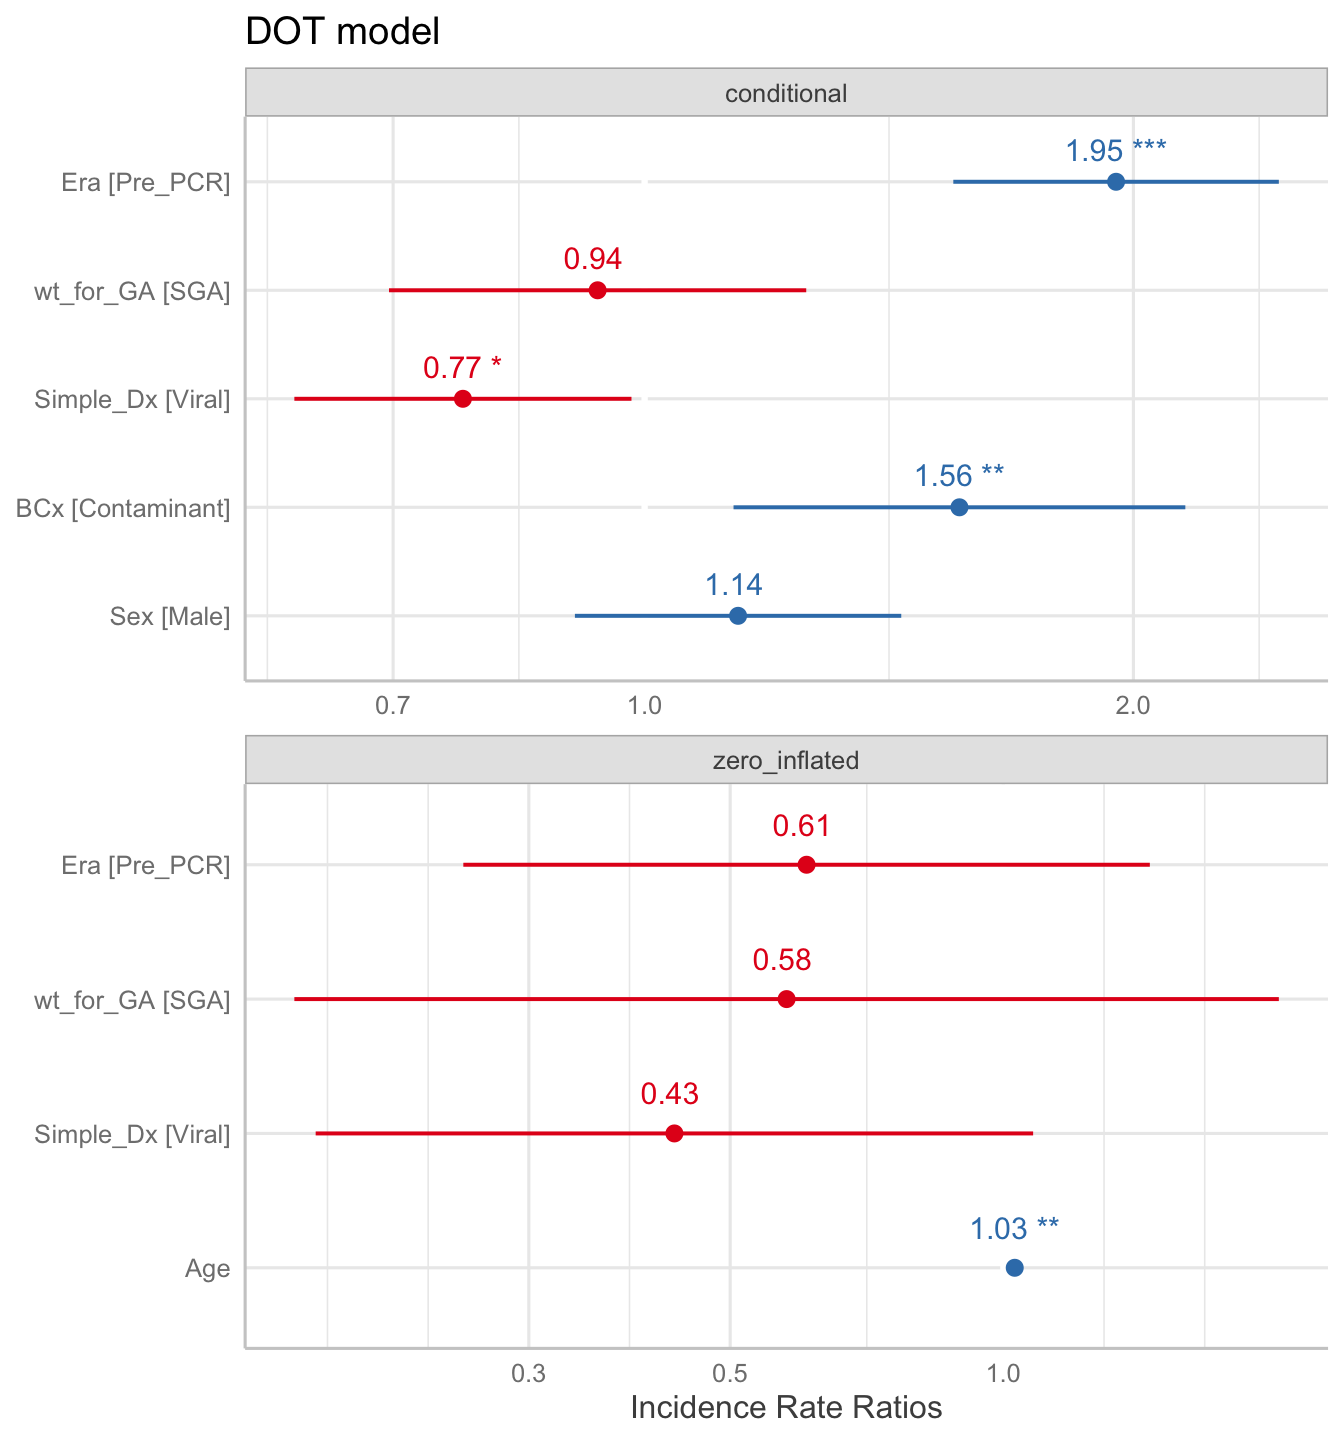
Looking at the results of the model above4, we see that Age is significant for the logistic regression. The odds ratio of not receiving any antibiotics was 0.43 for those who were ultimately diagnosed with a viral infection, but this wasn’t significant. Of note, the OR for those in the Pre-PCR era (OR = 0.61) is not significant.
Moving up to the conditional regression, we can see that the DOT was 1.95 times longer in the Pre-PCR era, compared to the Post-PCR era. We also can see that patients with contaminants on their blood culture had a longer duration of antibiotics, which makes sense.
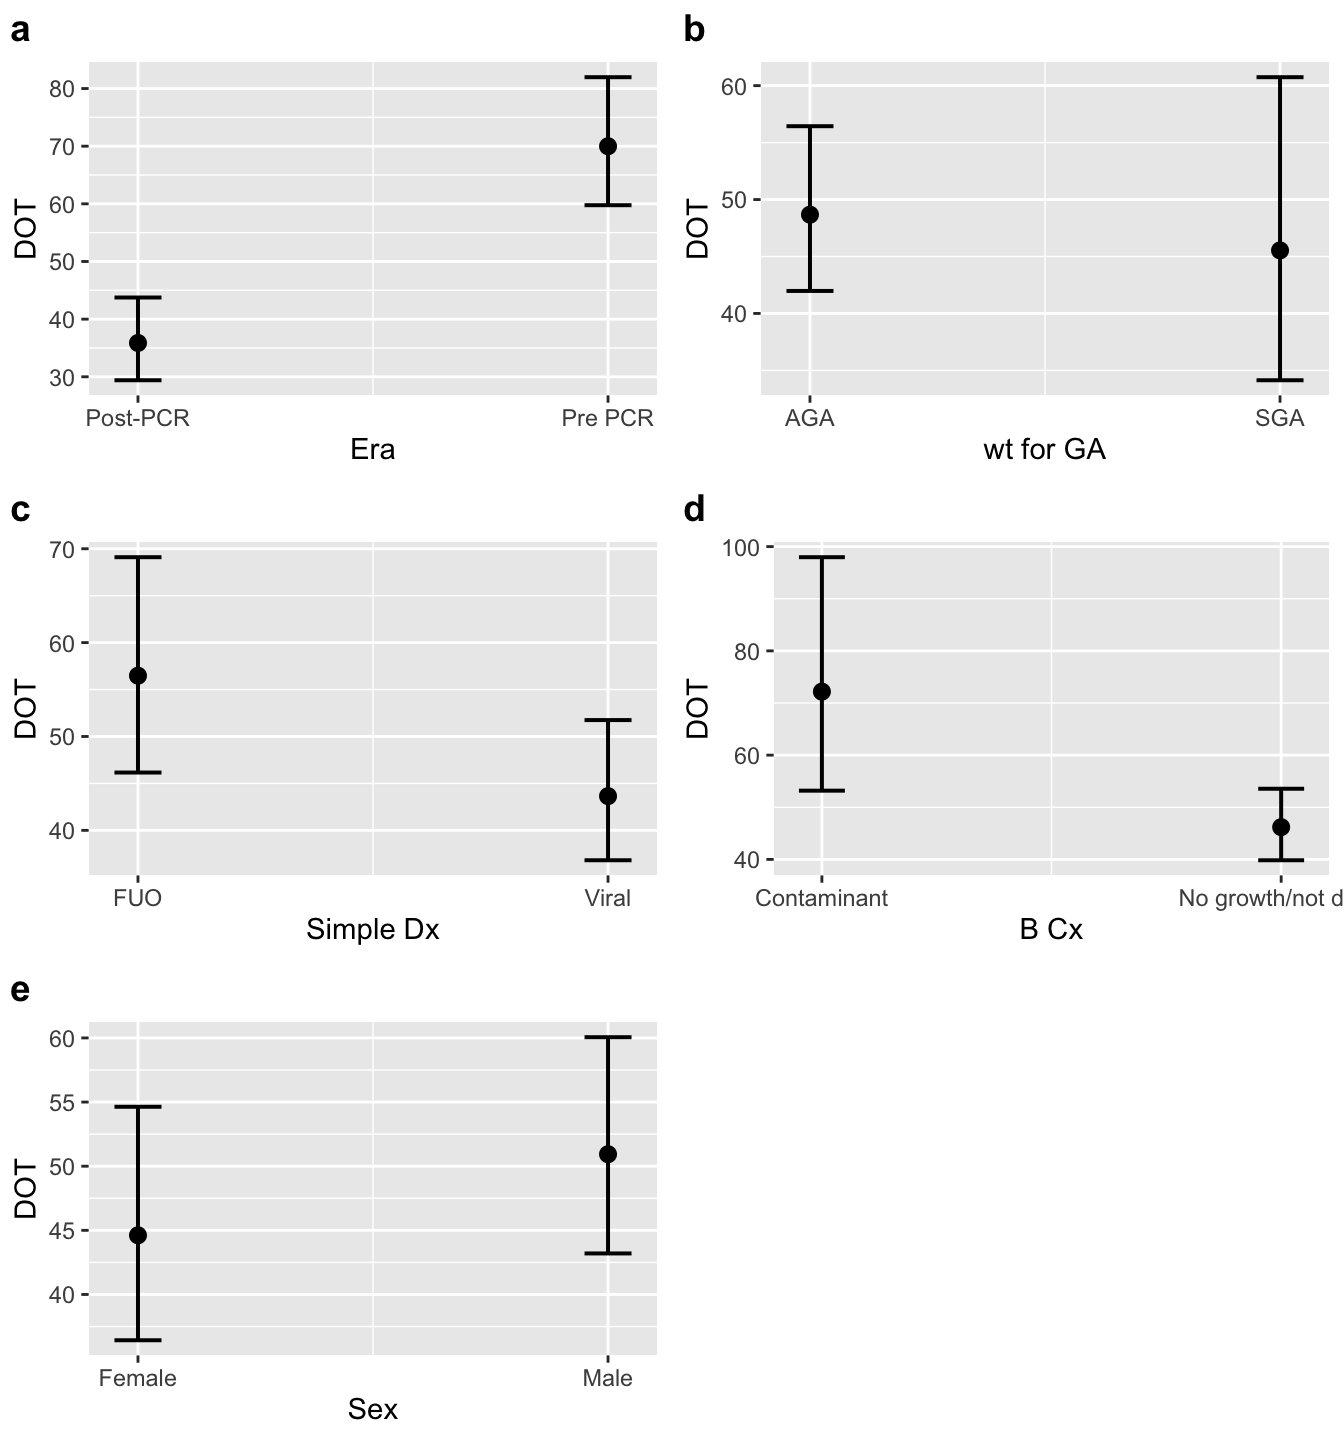
The conditional means for each era are presented below:
| Era | Conditional Mean | conf.low | conf.high |
|---|---|---|---|
| Post-PCR | 41.68 | 32.58 | 53.32 |
| Pre_PCR | 81.33 | 65.58 | 100.9 |
For the abstract
Methods
We performed a retrospective chart review of infants younger than 90 days old who were admitted to the pediatric ward for concerns of fever or sepsis from 1/1/2015 to 9/30/2019. Subjects with documented bacterial infections were excluded. Our primary outcomes were differences in DOT and LOS between patients admitted before and after PCRs became available (Pre-PCR era and PCR era).
Results
118 subjects were included in our analysis, with 52 (44.1%) coming from the Pre-PCR group. Descriptive statistics, stratified by era, are available in Table 1. The unadjusted mean LOS and DOT decreased by 8.4 (P = .0035) and 32.8 (P < .0016) hours, respectively.
Multivariate regression demonstrated that LOS was 1.16 times longer in the Pre-PCR era (95% CI: 1.1 - 1.22; P < .001). Similarly, patients in the Pre-PCR era had DOT that was 1.95 times longer (95% CI: 1.55 - 2.46; P < .001) when adjusting for covariates.
Tables / Figures
Abstract Table 1
| Abstract Table 1 | Era: Post-PCR (N = 66) | Era: Pre-PCR (N = 52) |
|---|---|---|
| Age on admission (days) | ||
| Mean (95% CI) | 28.44 (23.00 - 33.87) | 31.08 (25.18 - 36.98) |
| Median (IQR) | 22.0 (7.2, 44.8) | 29.0 (11.0, 50.0) |
| Range | 2 to 87 | 2 to 76 |
| Sex | ||
| Female | 31 (47.0%) | 19 (36.5%) |
| Male | 35 (53.0%) | 33 (63.5%) |
| Race | ||
| Black | 8 (12.1%) | 12 (23.1%) |
| White | 47 (71.2%) | 26 (50.0%) |
| Other | 11 (16.7%) | 14 (26.9%) |
| Gestational age (weeks) | ||
| Mean (95% CI) | 38.33 (37.90 - 38.75) | 38.30 (37.90 - 38.71) |
| Median (IQR) | 39.0 (37.6, 39.1) | 39.0 (37.2, 39.2) |
| Range | 33 to 41 | 34.5 to 40.6 |
| Birth weight (grams) | ||
| Mean (95% CI) | 3,086.05 (2,963.15 - 3,208.94) | 3,133.96 (3,009.84 - 3,258.08) |
| Median (IQR) | 3,153.0 (2,812.5, 3,417.5) | 3,136.0 (2,855.0, 3,462.8) |
| Range | 1760 to 4196 | 2070 to 4270 |
| Birth weight for gestational age | ||
| AGA | 57 (86.4%) | 42 (80.8%) |
| SGA | 9 (13.6%) | 10 (19.2%) |
Abstract Table 2
| Abstract Table 2 | Era: Post-PCR (N = 66) | Era: Pre-PCR (N = 52) |
|---|---|---|
| Length of stay (hours) | ||
| Mean (95% CI) | 47.64 (42.57 - 52.70) | 56.10 (51.01 - 61.18) |
| Median (IQR) | 47.0 (32.2, 56.0) | 56.5 (46.2, 68.5) |
| Range | 13 to 122 | 14 to 111 |
| Duration of therapy (hours) | ||
| Mean (95% CI) | 23.70 (18.64 - 28.75) | 56.50 (43.84 - 69.16) |
| Median (IQR) | 26.5 (0.0, 43.5) | 48.0 (15.2, 93.2) |
| Range | 0 to 60 | 0 to 158 |
| Discharge diagnosis | ||
| FUO | 26 (39.4%) | 19 (36.5%) |
| Viral | 40 (60.6%) | 33 (63.5%) |
| Respiratory PCR result | ||
| Pre-PCR | 0 (0.0%) | 52 (100.0%) |
| Negative | 19 (28.8%) | 0 (0.0%) |
| Not Done | 18 (27.3%) | 0 (0.0%) |
| Virus | 29 (43.9%) | 0 (0.0%) |
| Meningoencephalitis PCR result | ||
| Negative | 22 (33.3%) | 0 (0.0%) |
| Not Done | 32 (48.5%) | 0 (0.0%) |
| Pre-PCR | 0 (0.0%) | 52 (100.0%) |
| Virus | 12 (18.2%) | 0 (0.0%) |
| Blood culture | ||
| No growth/not done | 63 (95.5%) | 44 (84.6%) |
| Contaminant | 3 (4.5%) | 8 (15.4%) |
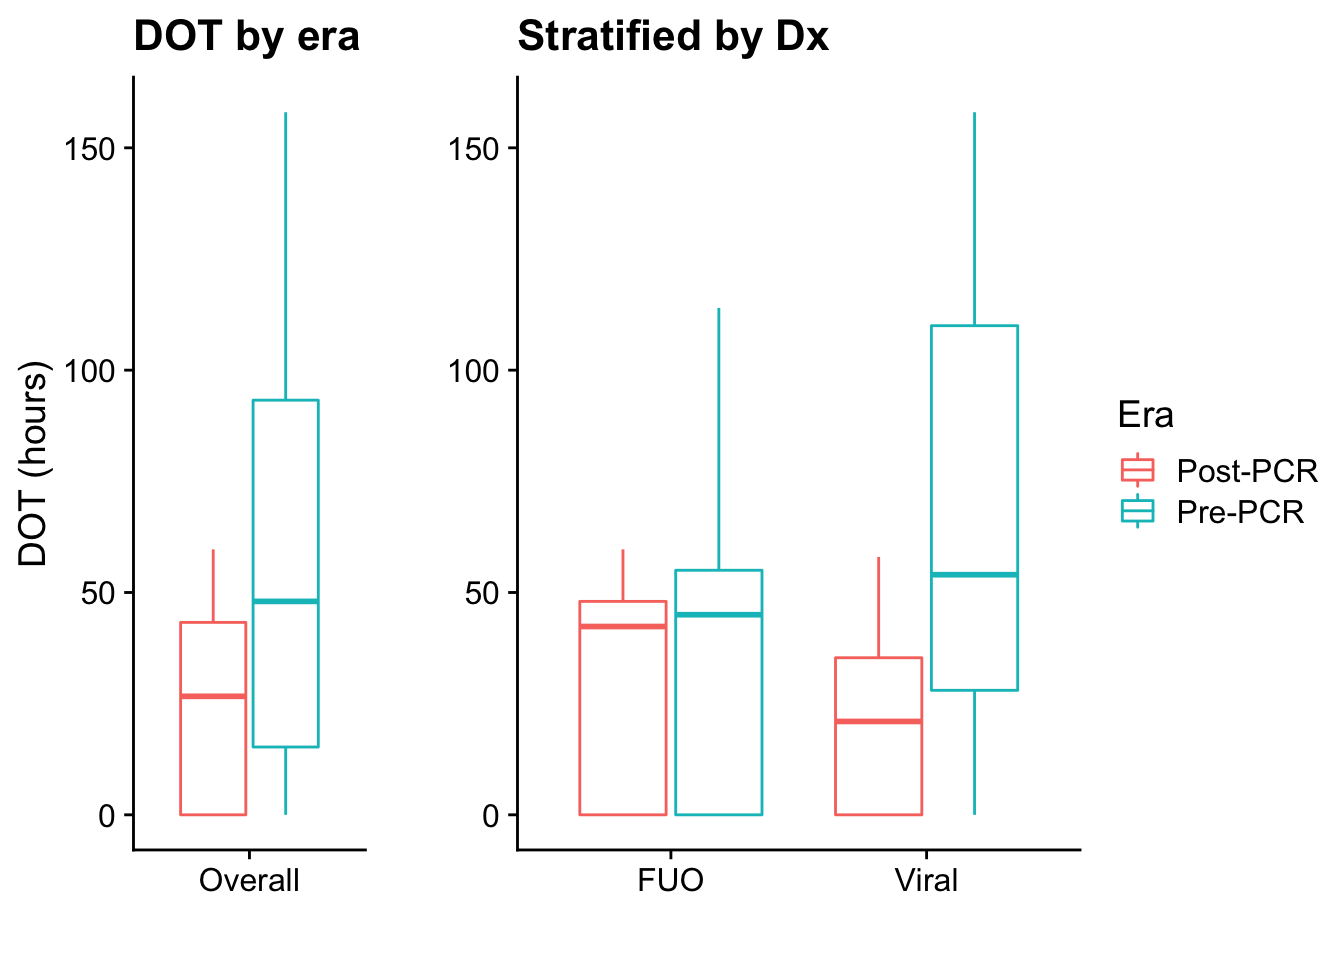
Abstract Figure 1
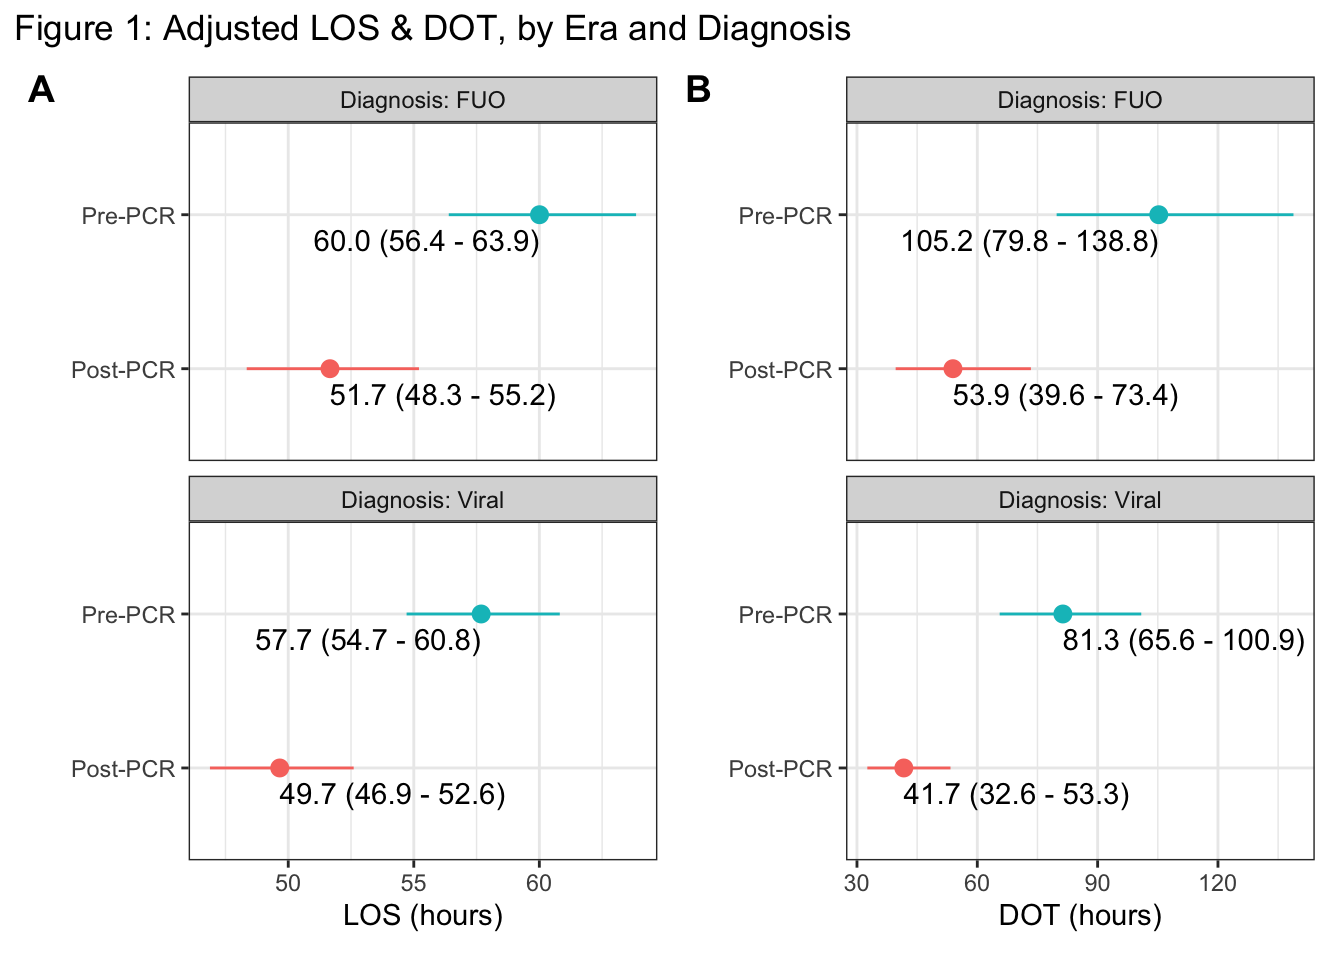
Figure 1: Multivariate adjusted estimates for the average length of stay [A] and duration of antibiotic therapy [B], stratified by discharge diagnosis (vertical panels) and PCR era (y-axis). Estimates (with 95% CI’s) are adjusted for Age, BCx, Era, Sex, Simple_Dx, wt_for_GA
Abstract Figure 2
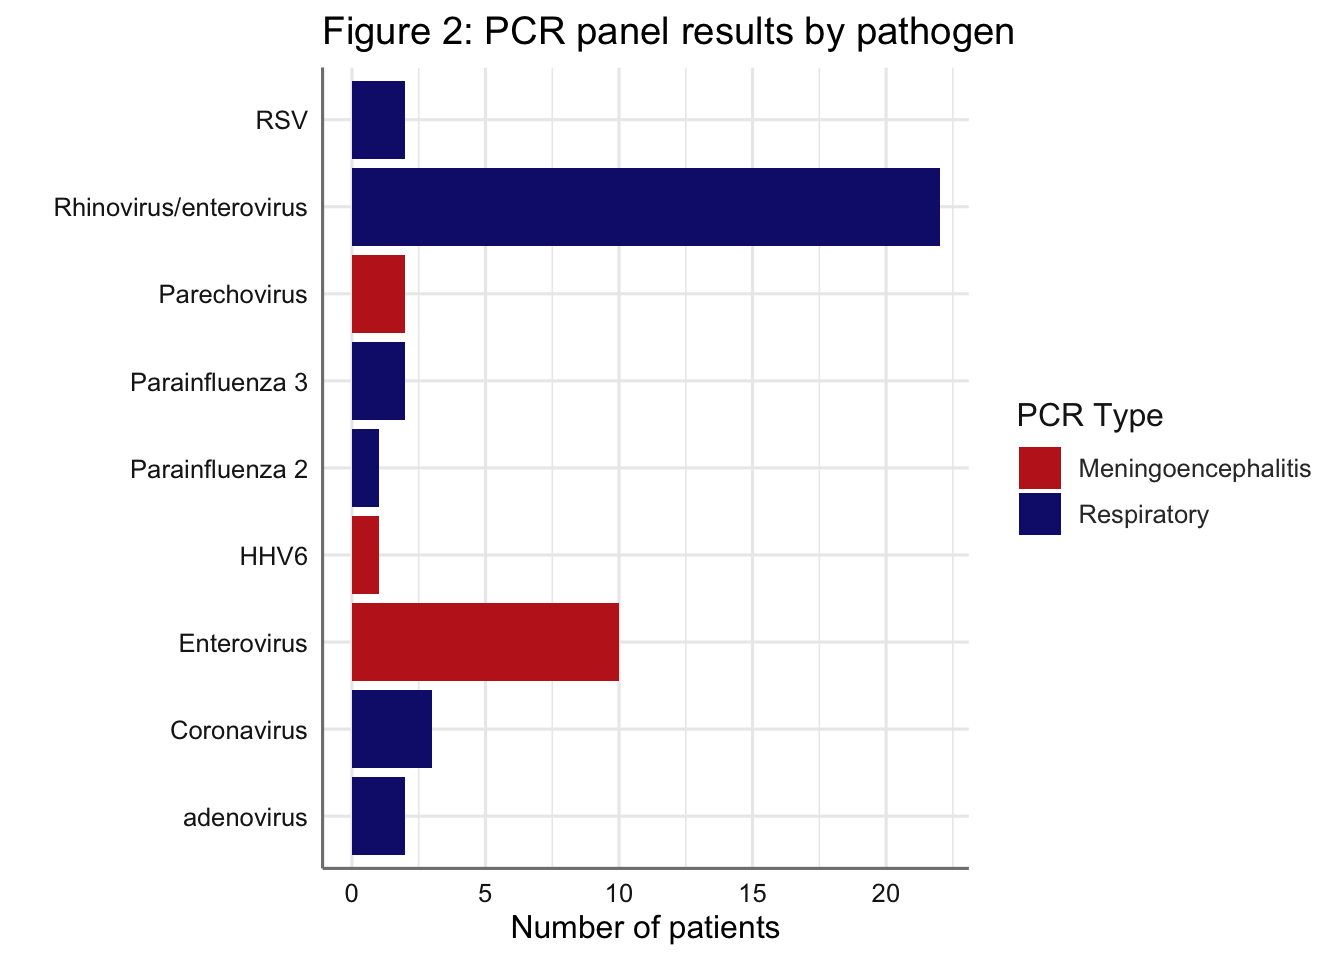
Figure 2: Results of the positive PCR panels by pathogen. Note that some patients appear in the figure more than once (e.g. if a patient had a respiratory PCR positive for Rhinovirus/enterovirus and a meningoencephalitis PCR positive for Enterovirus). Patients with negative results for the respiratory (n=19) or meningoencephalitis (n=22) panels are not shown.
End
For the poster
Fig 1:
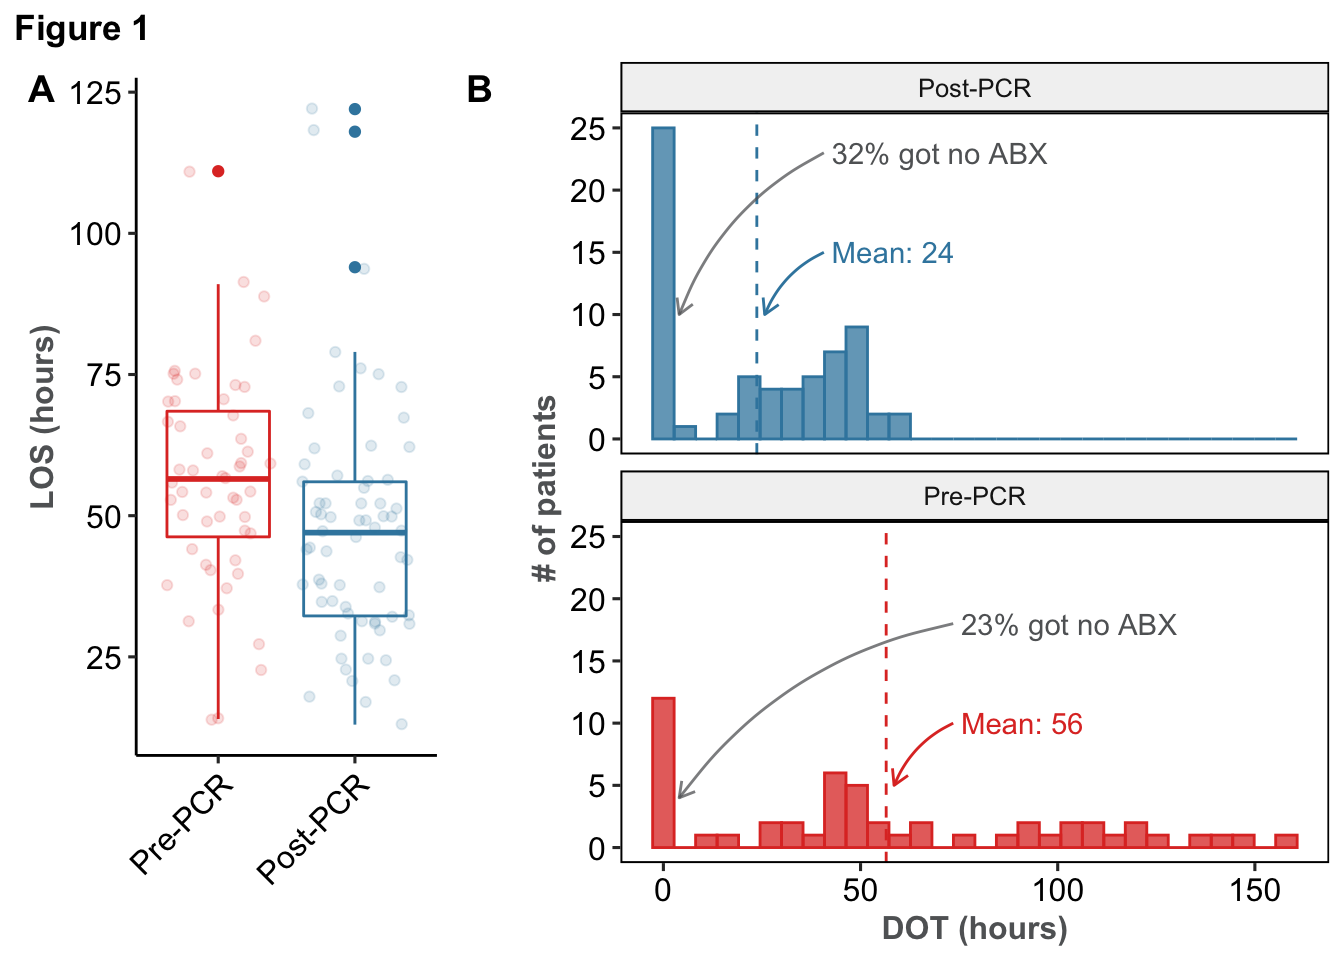
Table 1
| Table 1 | Era: Post-PCR (N = 66) | Era: Pre-PCR (N = 52) |
|---|---|---|
| Age on admission (days) | ||
| Mean (95% CI) | 28.44 (23.00 - 33.87) | 31.08 (25.18 - 36.98) |
| Median (IQR) | 22.0 (7.2, 44.8) | 29.0 (11.0, 50.0) |
| Range | 2 to 87 | 2 to 76 |
| Sex | ||
| Female | 31 (47.0%) | 19 (36.5%) |
| Male | 35 (53.0%) | 33 (63.5%) |
| Race | ||
| Black | 8 (12.1%) | 12 (23.1%) |
| White | 47 (71.2%) | 26 (50.0%) |
| Other | 11 (16.7%) | 14 (26.9%) |
| Gestational age (weeks) | ||
| Mean (95% CI) | 38.33 (37.90 - 38.75) | 38.30 (37.90 - 38.71) |
| Median (IQR) | 39.0 (37.6, 39.1) | 39.0 (37.2, 39.2) |
| Range | 33 to 41 | 34.5 to 40.6 |
| Birth weight (grams) | ||
| Mean (95% CI) | 3,086.05 (2,963.15 - 3,208.94) | 3,133.96 (3,009.84 - 3,258.08) |
| Median (IQR) | 3,153.0 (2,812.5, 3,417.5) | 3,136.0 (2,855.0, 3,462.8) |
| Range | 1760 to 4196 | 2070 to 4270 |
| Birth weight for gestational age | ||
| AGA | 57 (86.4%) | 42 (80.8%) |
| SGA | 9 (13.6%) | 10 (19.2%) |
Table 2
| Table 2: Adjusted LOS & DOT | ||||||
|---|---|---|---|---|---|---|
| Zero-inflated DOT not shown | ||||||
| LOS | DOT | |||||
| IRR | CI | p | IRR | CI | p | |
| Era: Pre-PCR | 1.16 | [ 1.10, 1.22] | < .001 | 1.95 | [ 1.55, 2.46] | < .001 |
| Birth weight: SGA | 1.06 | [ 0.99, 1.14] | 0.078 | 0.94 | [ 0.70, 1.26] | 0.659 |
| Dx: Viral infection | 0.96 | [ 0.91, 1.02] | 0.157 | 0.77 | [ 0.61, 0.98] | 0.035 |
| Age (per week) | 0.99 | [ 0.98, 1.00] | 0.003 | — | — | — |
| BCx: Contaminant | 1.13 | [ 1.04, 1.23] | 0.006 | 1.56 | [ 1.13, 2.15] | 0.006 |
| Sex: Male | 1.03 | [ 0.98, 1.09] | 0.259 | 1.14 | [ 0.91, 1.44] | 0.262 |
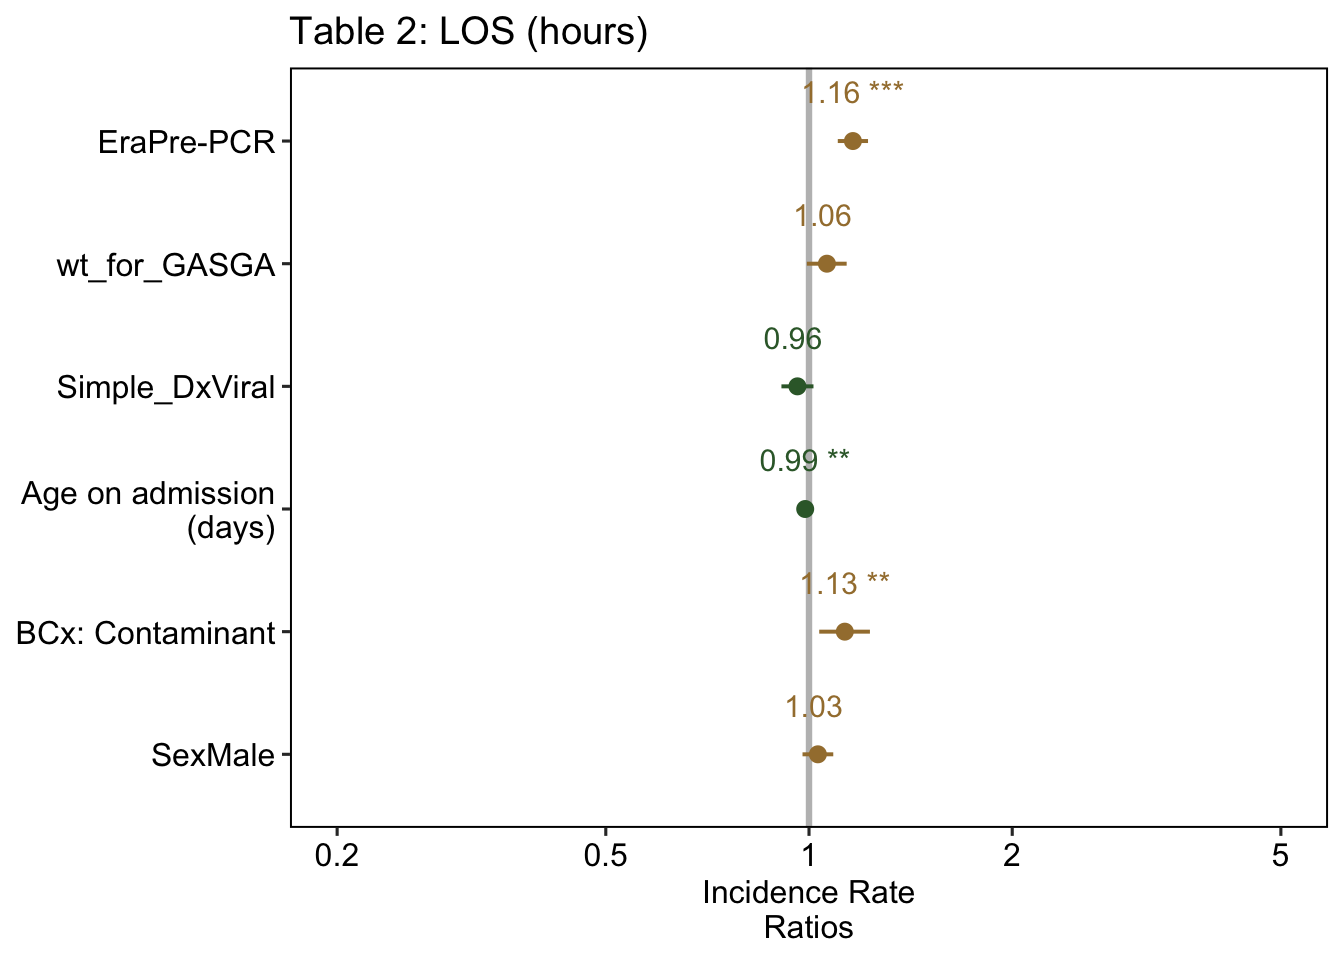
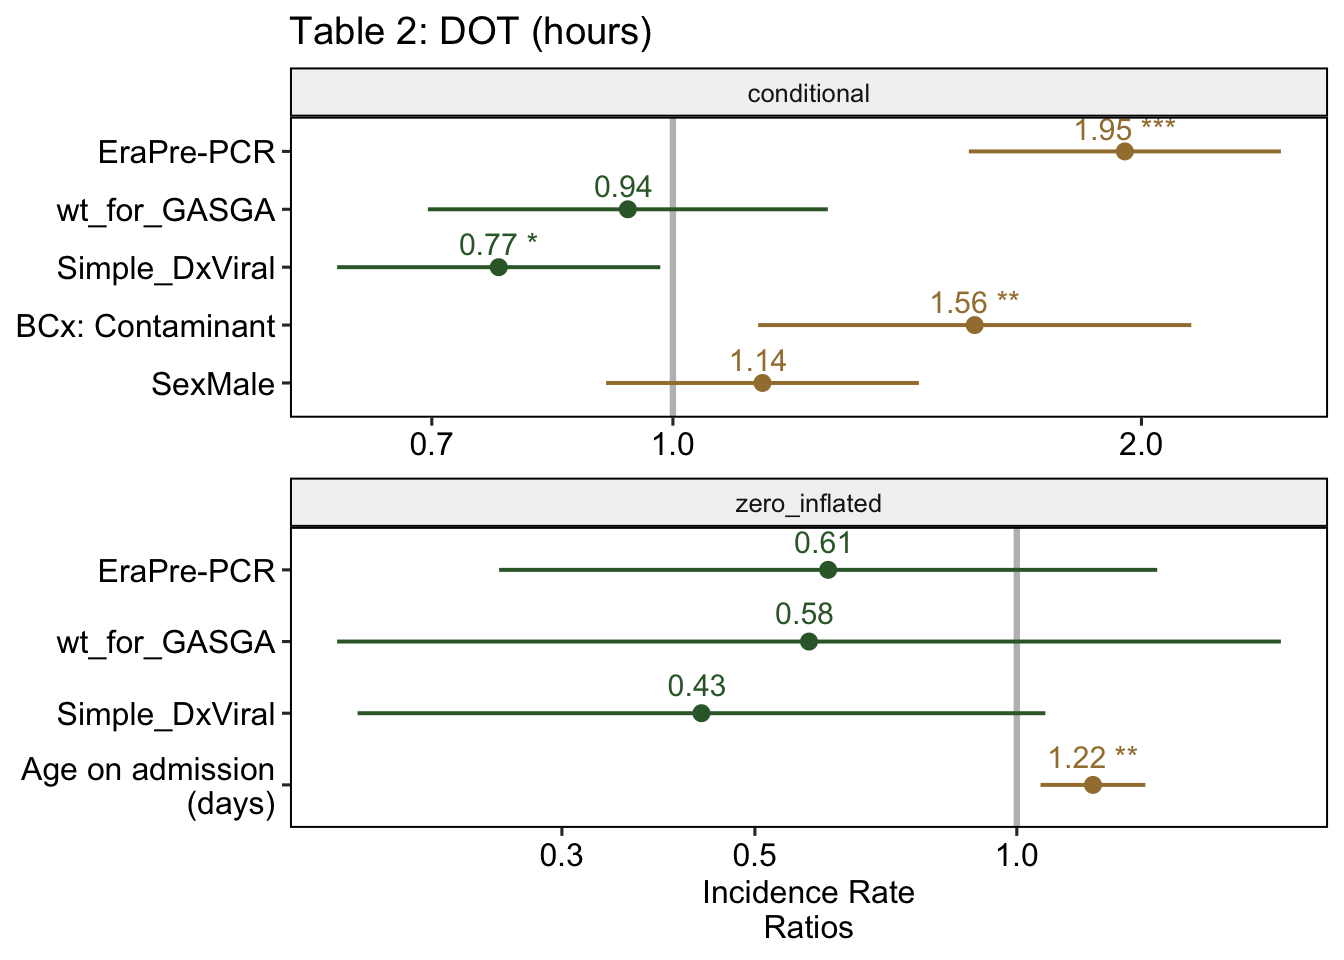
Fig 2
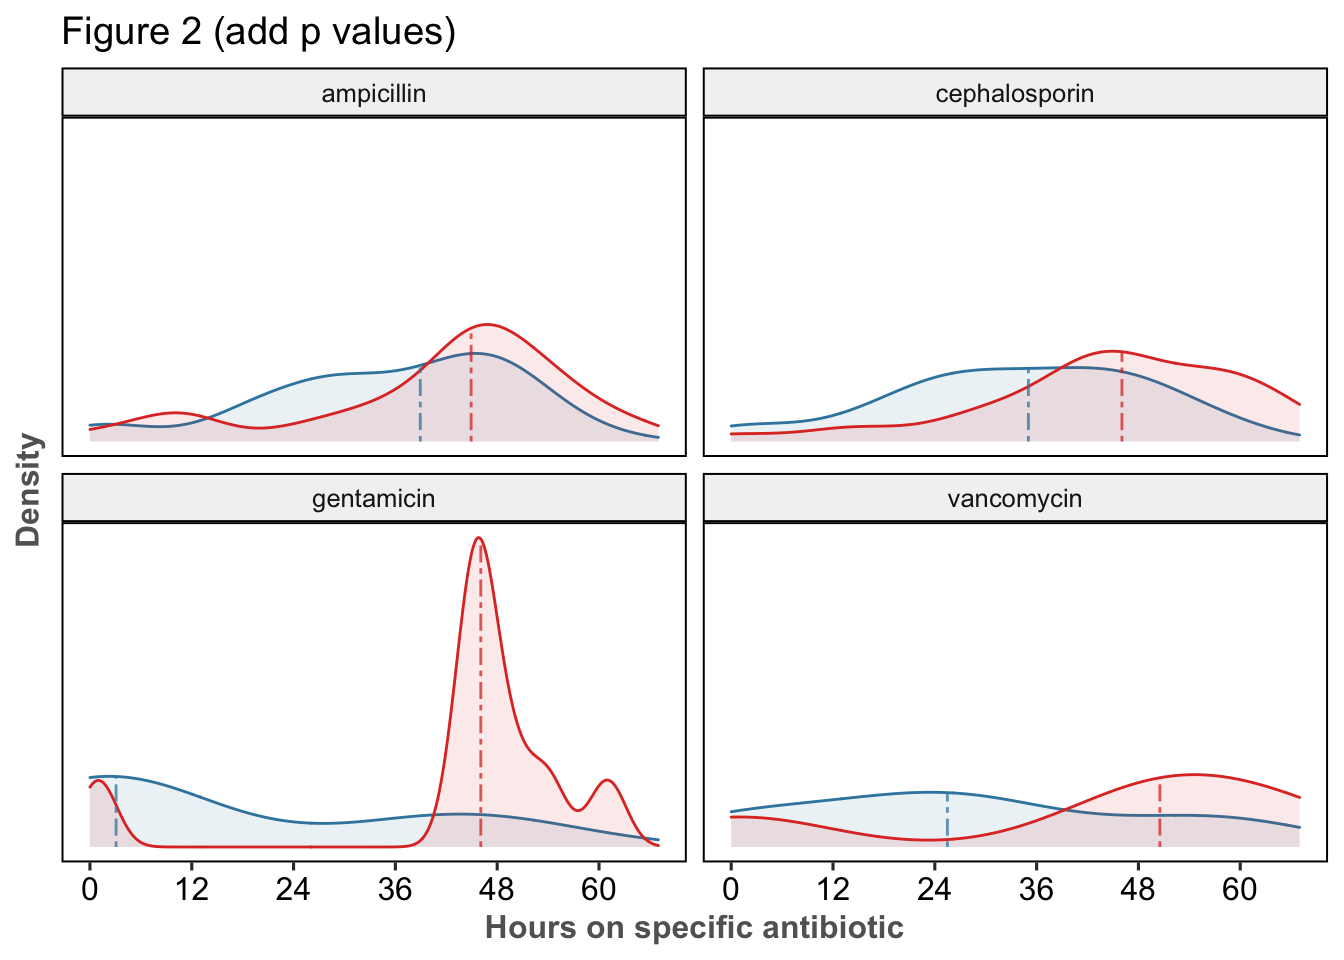
| p | median | n | |||
|---|---|---|---|---|---|
| Post-PCR | Pre-PCR | Post-PCR | Pre-PCR | ||
| acyclovir | 0.463 | 3 [2 - 7] | 6 [2 - 16] | 19 | 13 |
| ampicillin | 0.077 | 39 [28 - 47] | 45 [35 - 50] | 39 | 35 |
| cephalosporin | 0.003 | 35 [24 - 45] | 46 [39 - 56] | 40 | 33 |
| gentamicin | 0.019 | 3 [2 - 38] | 46 [45 - 50] | 9 | 9 |
| none | NaN | 0 [0 - 0] | 0 [0 - 0] | 21 | 11 |
| vancomycin | 0.561 | 26 [15 - 38] | 50 [36 - 57] | 4 | 4 |
On the off chance that a patient was given two cephalosporins at the same time (e.g. got Rocephin from
00:00to02:00and given ceftazidime from01:00to06:00), this is the sum of the total duration of each (2+5in this example), not the earliest admin to the last admin↩The actual interpretation is a bit more complicated, since we are technically modeling each hour of antibiotics as an event. Poisson distributions predict the number of events (e.g. number of lightning strikes) over a period of time. So it gets messy, but this is the best I can do for the time being↩
See histogram at the start of the section↩
At least for the run of the model at the time of writing. If the numbers no longer match up, it likely means the model has changed↩
Via Wilcoxon rank sum test with continuity correction↩
Via Wilcoxon rank sum test with continuity correction↩
Hunter Ratliff, MD, MPH
Infectious Diseases Fellow
My research interests include epidemiology, social determinants of health, and reproducible research.