High level summary
Overall, our study contained 25 subjects from the pre-PCR era and 48 subjects from the era where PCR was available (among of which 41 received at least one PCR panel). Subjects with a record status of incomplete in RedCAP are not included in this count (18 records).
The majority of infections documented were viral infections, with zero cases of bacterial meningitis. Of note, the among the positive PCR panels, 100% returned positive for a virus (excluding HSV). See Results of PCR & Cultures for more details.
Next we turn to how the PCR panels influenced LOS and duration of antibiotics. There was a difference in antibiotic duration between the Pre-PCR and Post-PCR eras (56 vs 33, respectively), but this isn’t of statistical significance unless you subset the data1.
Interestingly, the most pronounced findings occur when we consider the result of the PCR tests. Counterintuitively, a negative PCR panel is associated with a longer LOS and antibiotic duration.
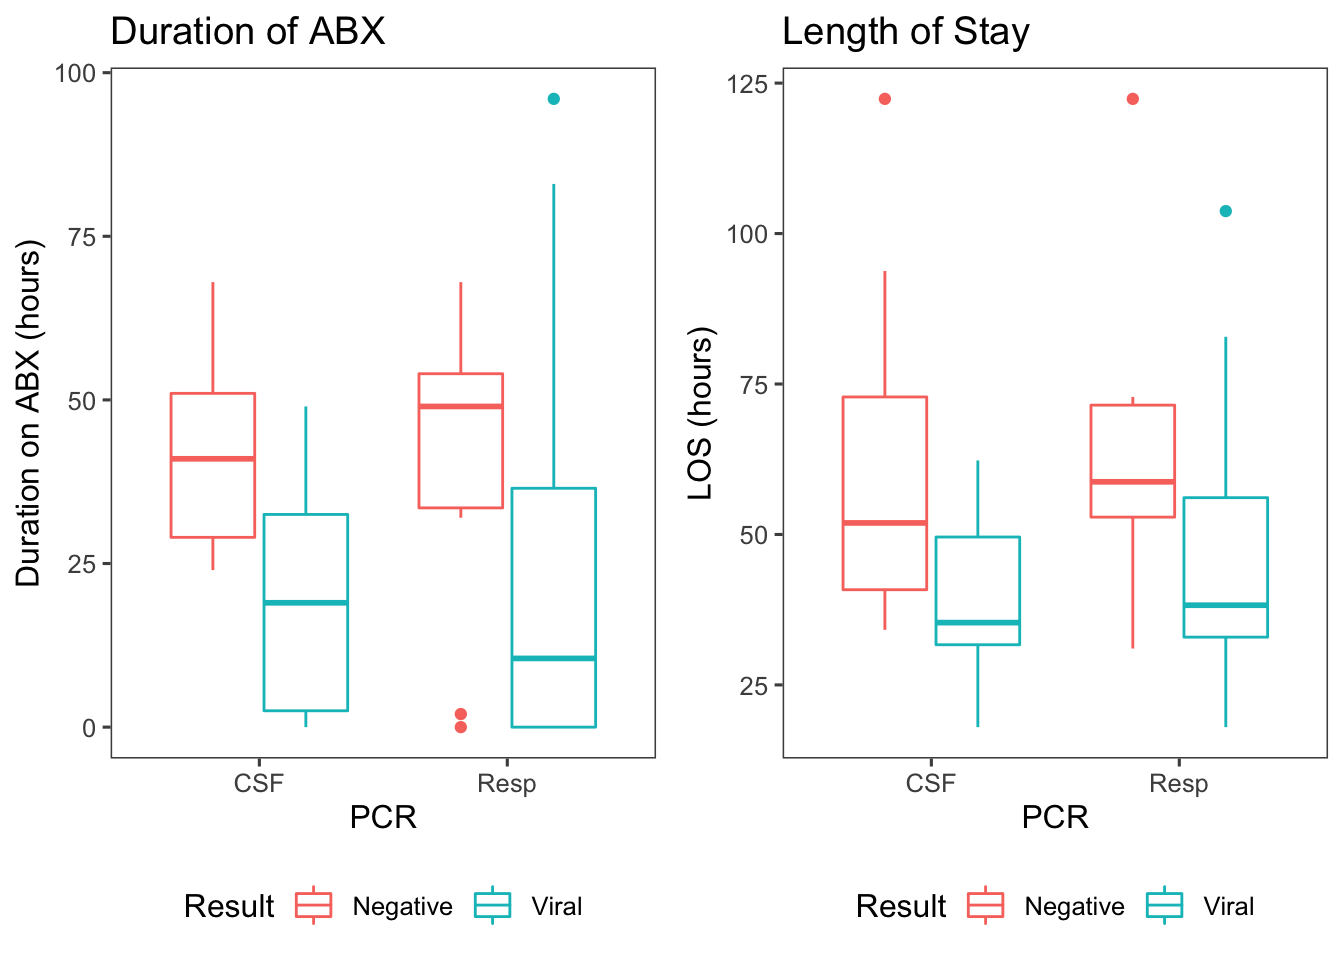
Figure 1: Antibiotic duration & length of stay by the results of PCR panels, where ‘viral’ means the PCR returned positive for a virus and ‘negative’ means the entire panel resulted negative.
Presumably, this occurs because a PCR that returns positive for a virus means that the source of the fever has been identified. This finding is highly significant, with a viral PCR reducing antibiotic duration by approximately 26 hours (p = 2.73e-04; 95% CI: [12-34]) and reducing LOS by approximately 17 hours (p = 1.9e-03; 95% CI: [7-29])2.
Diagnosis
Because patient’s are allowed to have more than one diagnosis, I’ve re-coded some of the diagnosis data to simplify it. See the code for full details, but I made new categories for Pyelonephritis, Bacterial gastroenteritis, Viral gastroenteritis, Urosepsis3. I also excluded one subject (55), because they had a left inguinal abscess that was present on admission.
In the tables below, you can find the median duration of antibiotics for each diagnosis, broken down by the PCR era:
| Diagnosis | Pre-PCR | W/ PCR |
|---|---|---|
| Bacterial gastroenteritis | NA | 64 (n=2) |
| FUO | 60 (n=3) | 44.5 (n=4) |
| NonInfxn | 39.5 (n=6) | 23 (n=6) |
| Pyelonephritis | 46 (n=1) | 83 (n=1) |
| Urosepsis | 284 (n=2) | 124.5 (n=2) |
| UTI | 46 (n=1) | 62 (n=7) |
| Viral gastroenteritis | 27.5 (n=2) | NA |
| Viral Meningitis | 28 (n=3) | 20.5 (n=12) |
| Viral URI | 42 (n=7) | 0 (n=14) |
Note: Check out the median duration of antibiotics for those diagnosed with a viral URI.
Below is a similar table for length of stay:
| Diagnosis | Pre-PCR | W/ PCR |
|---|---|---|
| Bacterial gastroenteritis | NA | 72.3 (n=2) |
| FUO | 61.1 (n=3) | 44.8 (n=4) |
| NonInfxn | 56.2 (n=6) | 61.6 (n=6) |
| Pyelonephritis | 62.3 (n=1) | 82.8 (n=1) |
| Urosepsis | 316.2 (n=2) | 147 (n=2) |
| UTI | 54.4 (n=1) | 69.5 (n=7) |
| Viral gastroenteritis | 52.8 (n=2) | NA |
| Viral Meningitis | 63.7 (n=3) | 41.2 (n=12) |
| Viral URI | 52.7 (n=7) | 38.2 (n=14) |
Results of PCR & Cultures
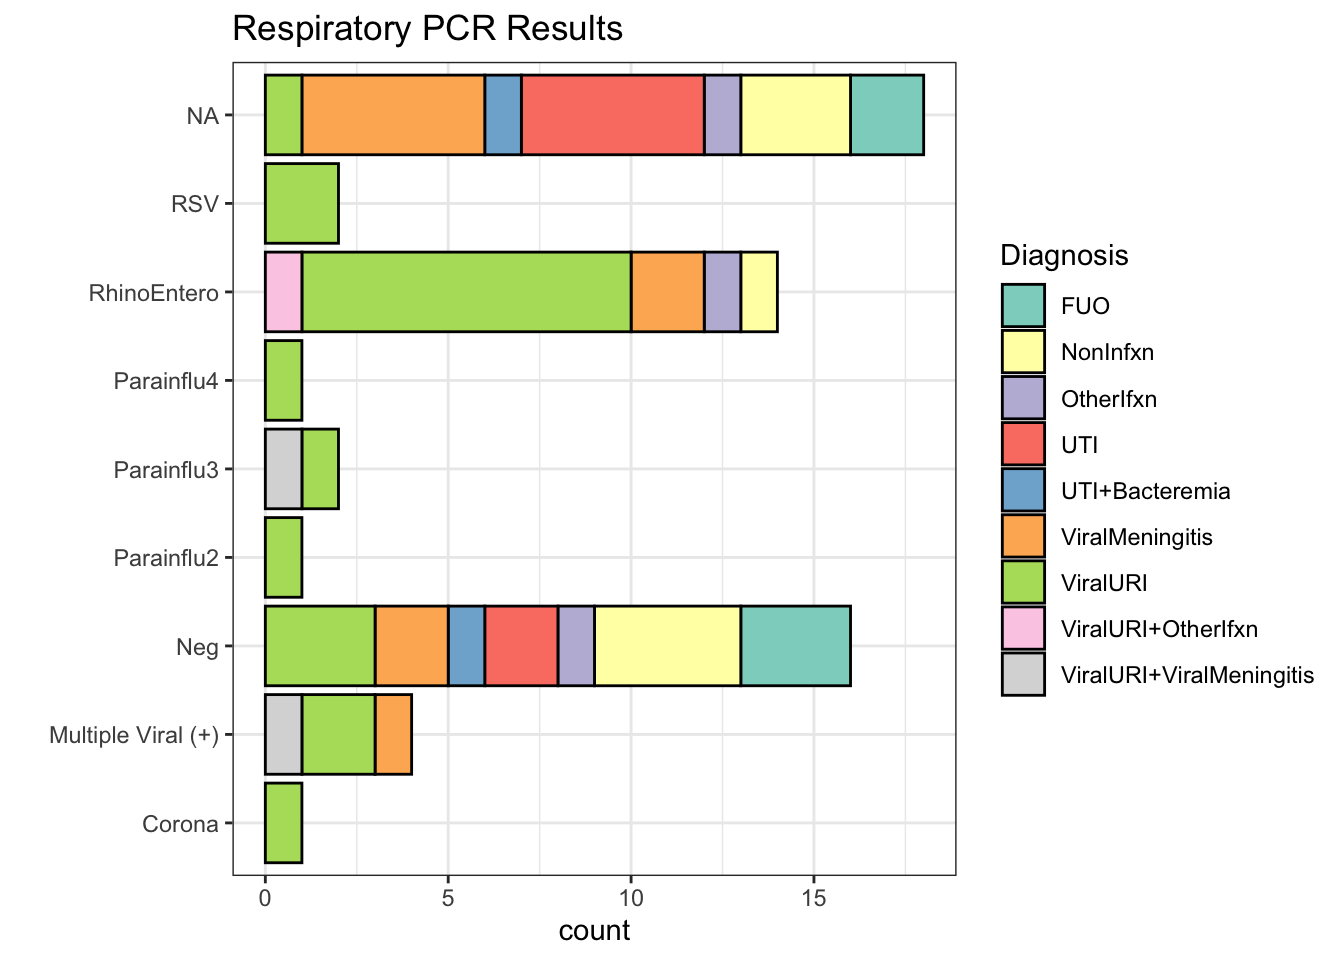
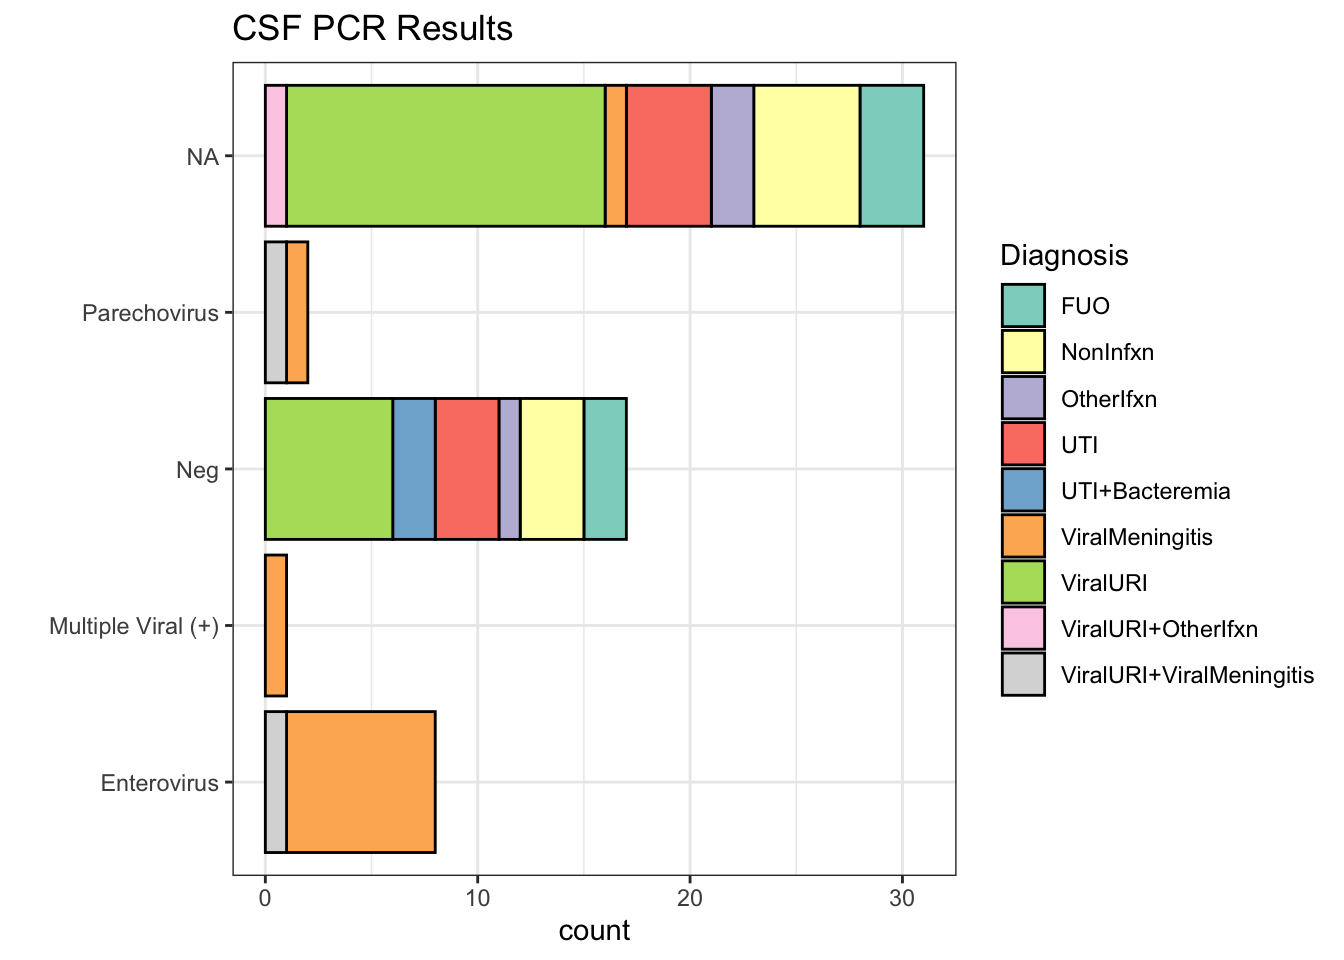
Below are the results of both the PCR panels (Respiratory & CSF) and the cultures of all of the subjects in the study. The bar graphs for the PCR results are broken down by the patient’s ultimate diagnosis, with the same results listed below the graph in table format. If a result is listed as NA it means that the PCR/Culture wasn’t preformed.
Of note, among all the PCRs preformed, the result was either negative or a (non-HSV) virus. In future sections of this report, the result of the PCRs will be simplified to be either Negative, Viral, NA (meaning not preformed).
Respiratory PCR Results
| Respiratory PCR Result | Number of subjects | % |
|---|---|---|
| NA | 18 | 31% |
| Neg | 16 | 27% |
| RhinoEntero | 14 | 24% |
| Multiple Viral (+) | 4 | 7% |
| Parainflu3 | 2 | 3% |
| RSV | 2 | 3% |
| Corona | 1 | 2% |
| Parainflu2 | 1 | 2% |
| Parainflu4 | 1 | 2% |
For the patient(s) with >1 positives on the PCR panel, the results were:
| uid | PCR.Resp |
|---|---|
| 3 | Adeno + RSV |
| 5 | Adeno + RhinoEntero |
| 24 | Adeno + RhinoEntero |
| 77 | Corona + RhinoEntero |
CSF PCR Results
| CSF PCR Result | Number of subjects | % |
|---|---|---|
| NA | 31 | 52.5% |
| Neg | 17 | 28.8% |
| Enterovirus | 8 | 13.6% |
| Parechovirus | 2 | 3.4% |
| Multiple Viral (+) | 1 | 1.7% |
For the patient(s) with >1 positives on the PCR panel, the results were:
| uid | PCR.CSF |
|---|---|
| 40 | Enterovirus + HHV6 |
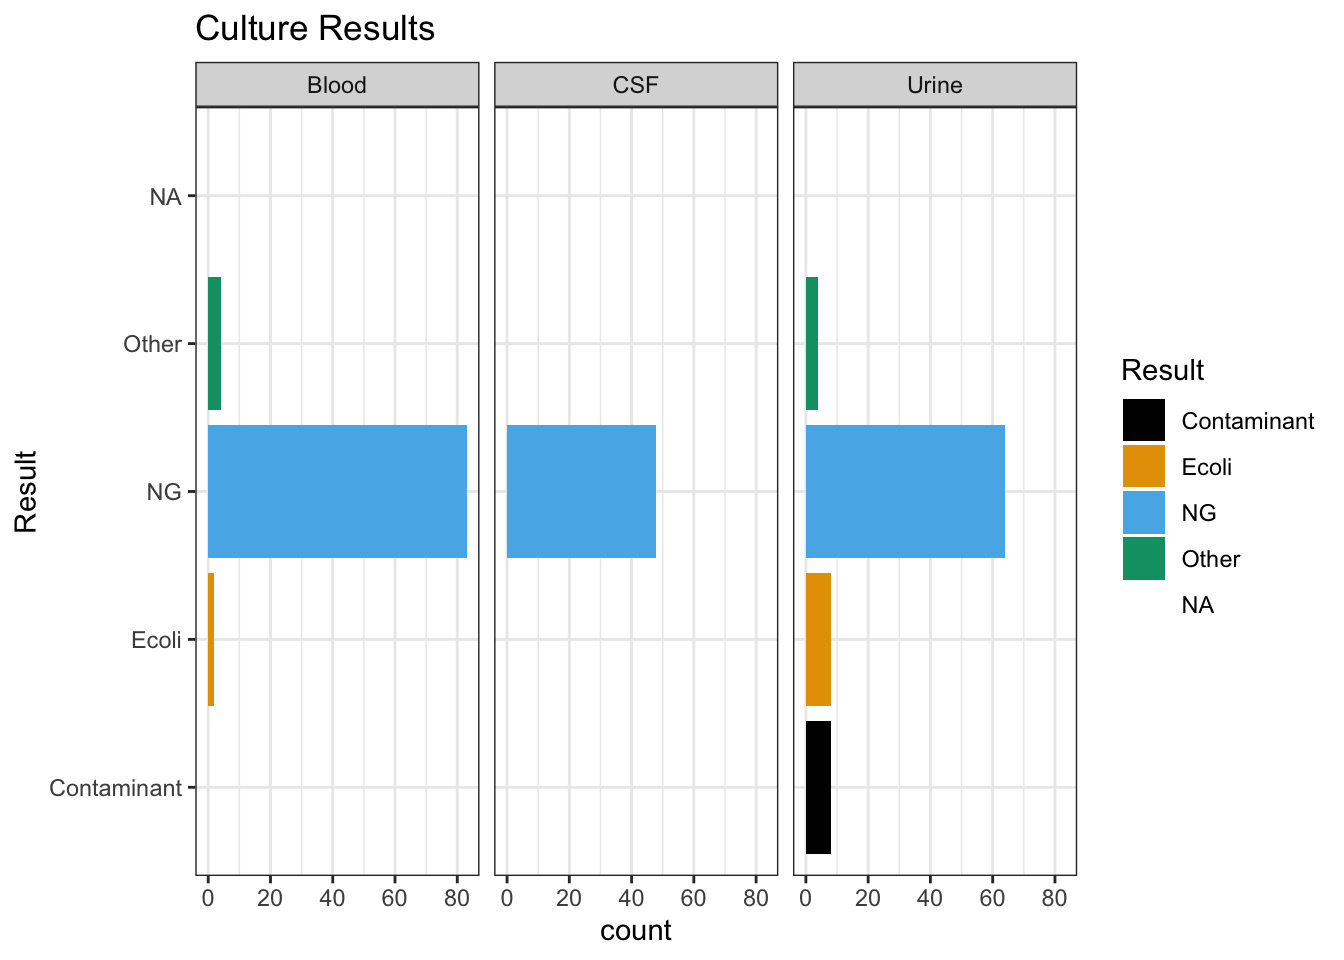
Culture Results
How does the PCR affect ABX usage & LOS?
These results exclude the top 95th percentile of antibiotic duration, as they are clearly outliers. I’m also excluding the 95th percentile of length of stay for the same reason. In the future, we might want to figure out a more refined way to identify outliers
Before we talk about the areas where there was a significant difference, I ran a number of tests that did not find any statistical difference between groups.
I found no difference between the Pre-PCR and Post-PCR era regarding ABX duration (ABX, p = 0.24) or length of stay (LOS, p = 0.48). Among those in the Post-PCR era, it also didn’t appear that their ABX/LOS was influenced by whether they received a PCR panel or not. This was true for both the respiratory panel (ABX, p = 0.21; LOS, p = 0.37) and the CSF panel (ABX, p = 0.76; LOS, p = 0.45).
My impression of these findings is that it’s presumably the result of the PCR that’s making the difference, not something systemic about having the PCR available or patients appearing sick enough to warrant a PCR / LP.
Respiratory PCR
First we’ll take a look at the respiratory PCR, and how it affected the duration of antibiotics (figure 2) and length of stay (figure 3). Note: the NA group are subjects who did not get a respiratory PCR, but were in the era of the PCR panels
Max hours on antibiotics
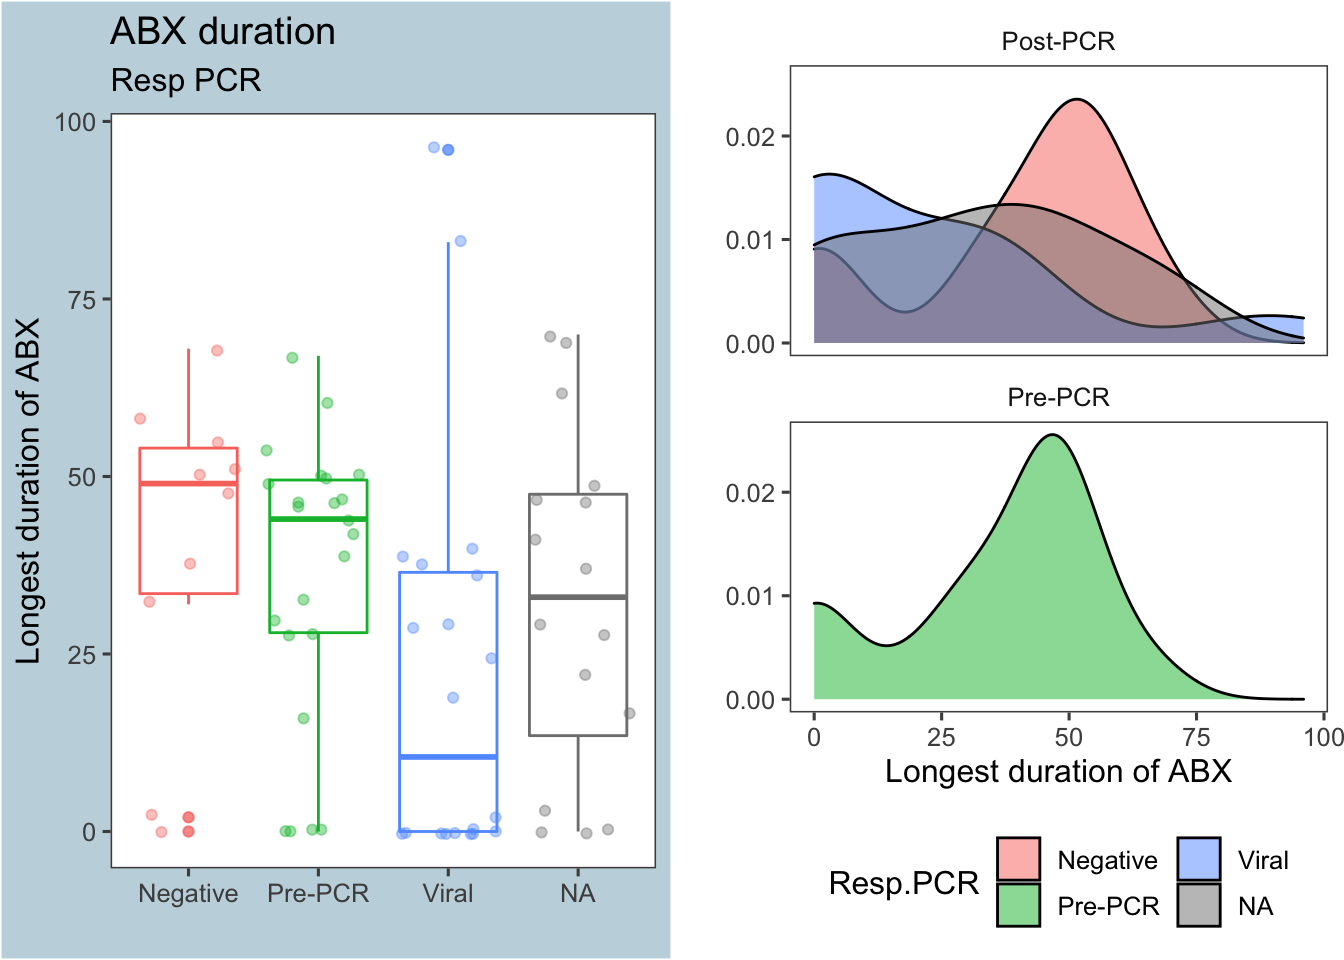
Figure 2: Antibiotic duration by respiratory PCR results
As illustrated in Figure 2 above, a respiratory PCR that came back positive for a viral infection greatly decreased the duration of antibiotics. The table below shows the summary stats for each group:
| PrePCR | Resp.PCR | median | mean | sd | nSubjects |
|---|---|---|---|---|---|
| Post-PCR | Negative | 49 | 40.2 | 22.92 | 10 |
| Post-PCR | Viral | 10.5 | 21.75 | 28.22 | 20 |
| Post-PCR | NA | 33 | 32.5 | 24.2 | 16 |
| Pre-PCR | Pre-PCR | 44 | 35.87 | 20.12 | 23 |
A Mann-Whitney test comparing the number of hours on antibiotics between the PCR results Negative and Viral returns a p-value <0.05
##
##  Wilcoxon rank sum test with continuity correction
##
## data:  maxHrABX by Resp.PCR
## W = 151.5, p-value = 0.0222
## alternative hypothesis: true location shift is not equal to 0
## 95 percent confidence interval:
##   1.999966 47.999996
## sample estimates:
## difference in location
##               25.99993
Length of Stay
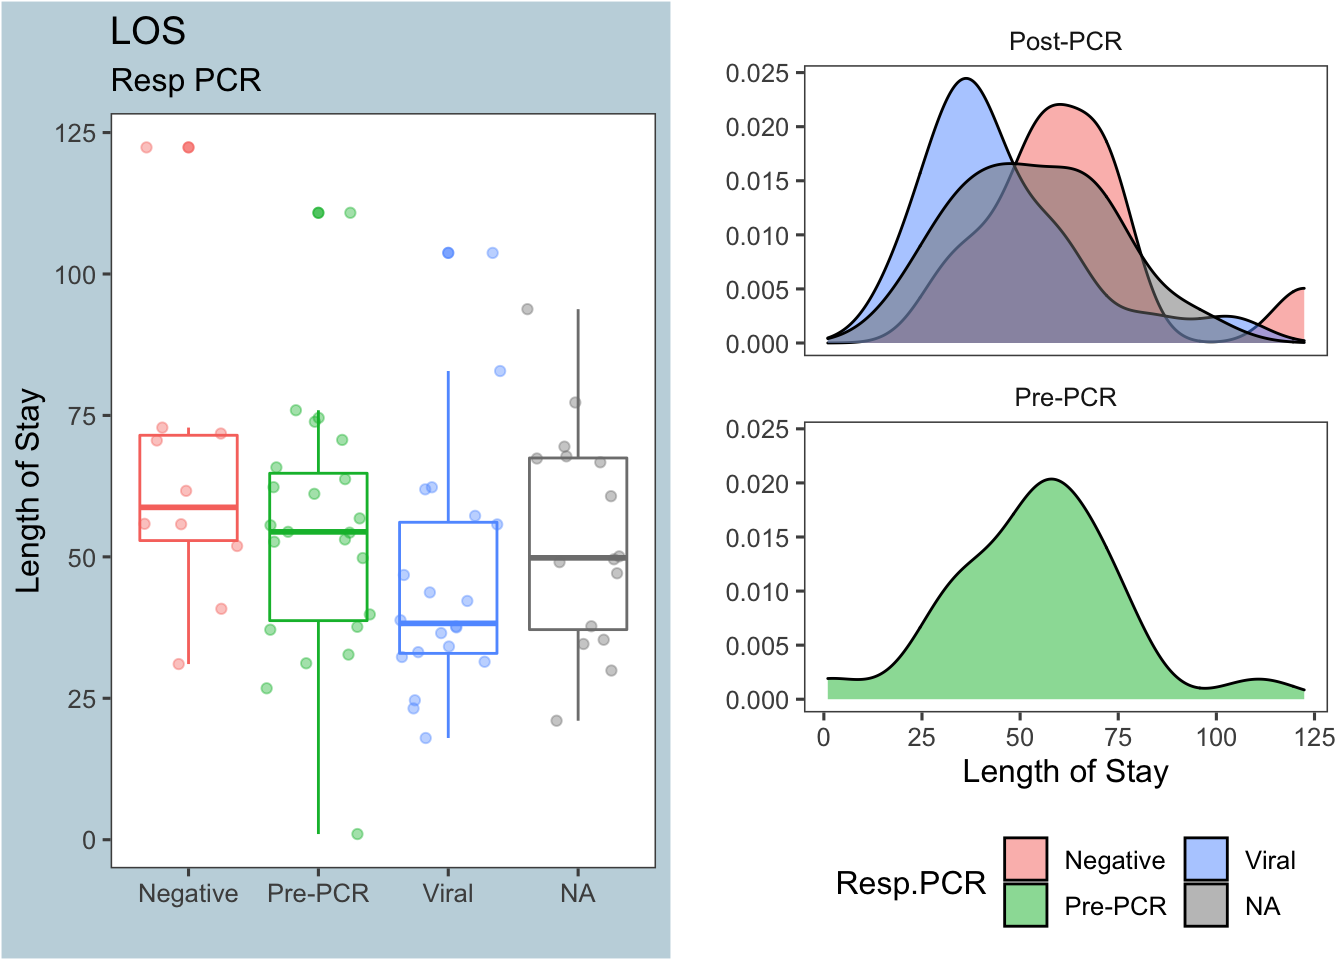
Figure 3: Length of stay by respiratory PCR results
Figure 3 shows that a viral (+) respiratory PCR might decrease the length of stay, but the difference isn’t nearly as pronounced as it is for antibiotic duration. Again, the table below shows the summary stats for each group:
| PrePCR | Resp.PCR | median | mean | sd | nSubjects |
|---|---|---|---|---|---|
| Post-PCR | Negative | 58.75 | 63.46 | 24.71 | 10 |
| Post-PCR | Viral | 38.24 | 45.2 | 20.76 | 20 |
| Post-PCR | NA | 49.83 | 53.6 | 19.49 | 16 |
| Pre-PCR | Pre-PCR | 54.42 | 53.99 | 21.81 | 23 |
The Mann-Whitney test comparing length of stay between the PCR results Negative and Viral returns a borderline p-value, and this may/may not be significant depending on how we decide to exclude outliers
##
##  Wilcoxon rank sum test with continuity correction
##
## data:  los by Resp.PCR
## W = 148, p-value = 0.03664
## alternative hypothesis: true location shift is not equal to 0
## 95 percent confidence interval:
##   2.016672 33.033313
## sample estimates:
## difference in location
##               18.11733
CSF PCR
Now we’ll take a look at the CSF PCR, and how it affected the duration of antibiotics (figure 4) and length of stay (figure 5). As before, the NA group are subjects who did not get a CSF PCR, but were in the era of the PCR panels
Max hours on antibiotics
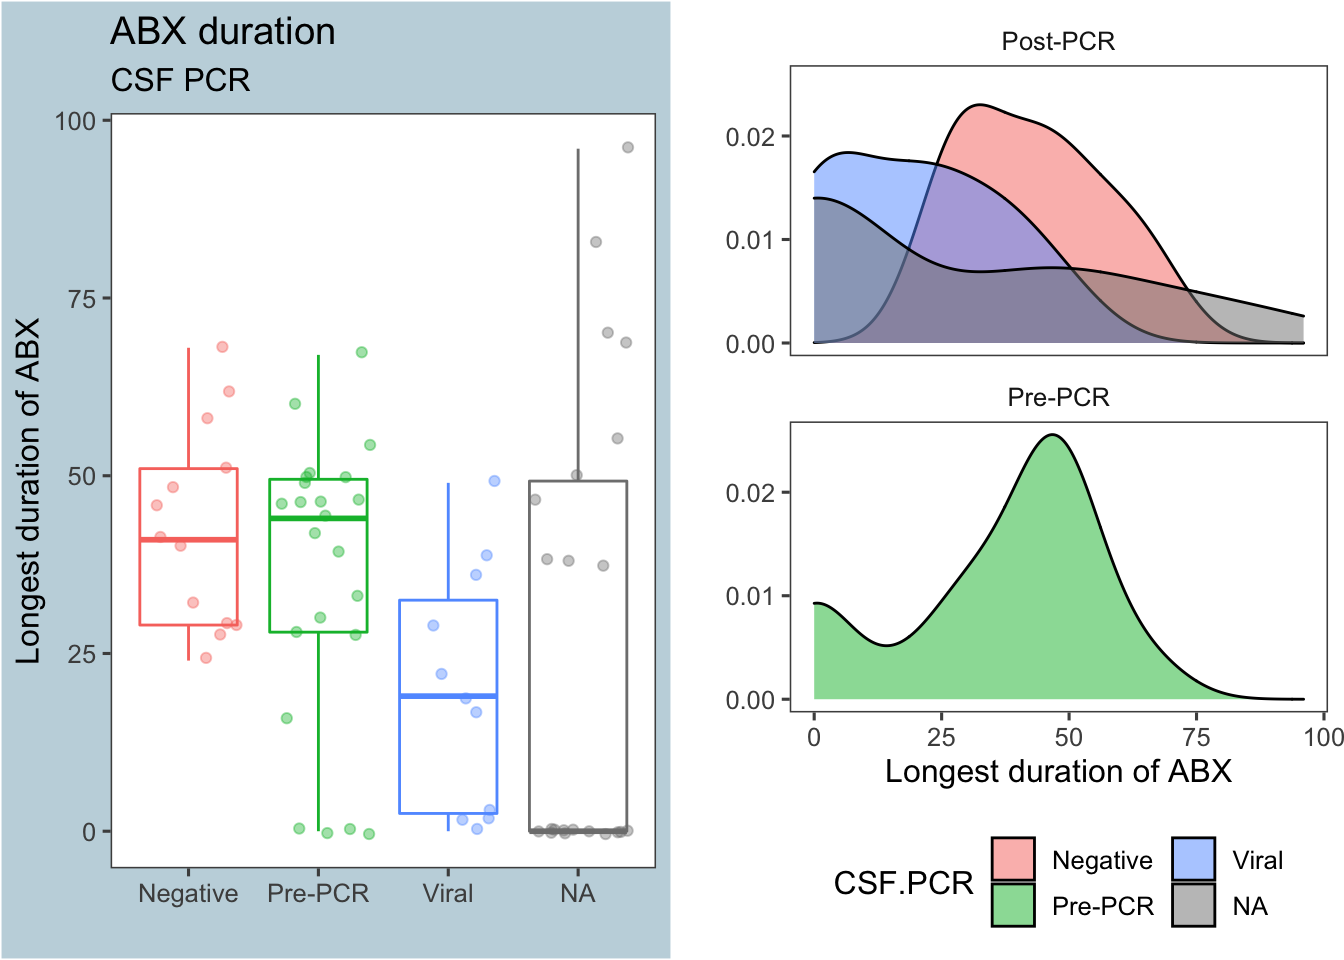
Figure 4: Antibiotic duration by CSF PCR results
As before (in Figure 2), a positive viral result on the CSF PCR decreased antibiotic use compared to a negative CSF PCR panel.
Interestingly, the median duration of antibiotics for those who did not get a CSF PCR panel (the NA group) was zero, as shown in the summary stats below. We’ll come back to this later at the bottom of this section
| PrePCR | CSF.PCR | median | mean | sd | nSubjects |
|---|---|---|---|---|---|
| Post-PCR | Negative | 41 | 42.77 | 14.2 | 13 |
| Post-PCR | Viral | 19 | 19.82 | 17 | 11 |
| Post-PCR | NA | 0 | 26.5 | 32.59 | 22 |
| Pre-PCR | Pre-PCR | 44 | 35.87 | 20.12 | 23 |
A Mann-Whitney test comparing the number of hours on antibiotics between the PCR results Negative and Viral returns a p-value <0.05:
##
## Wilcoxon rank sum test with continuity correction
##
## data: maxHrABX by CSF.PCR
## W = 121, p-value = 0.004483
## alternative hypothesis: true location shift is not equal to 0
## 95 percent confidence interval:
## 8.999966 38.000026
## sample estimates:
## difference in location
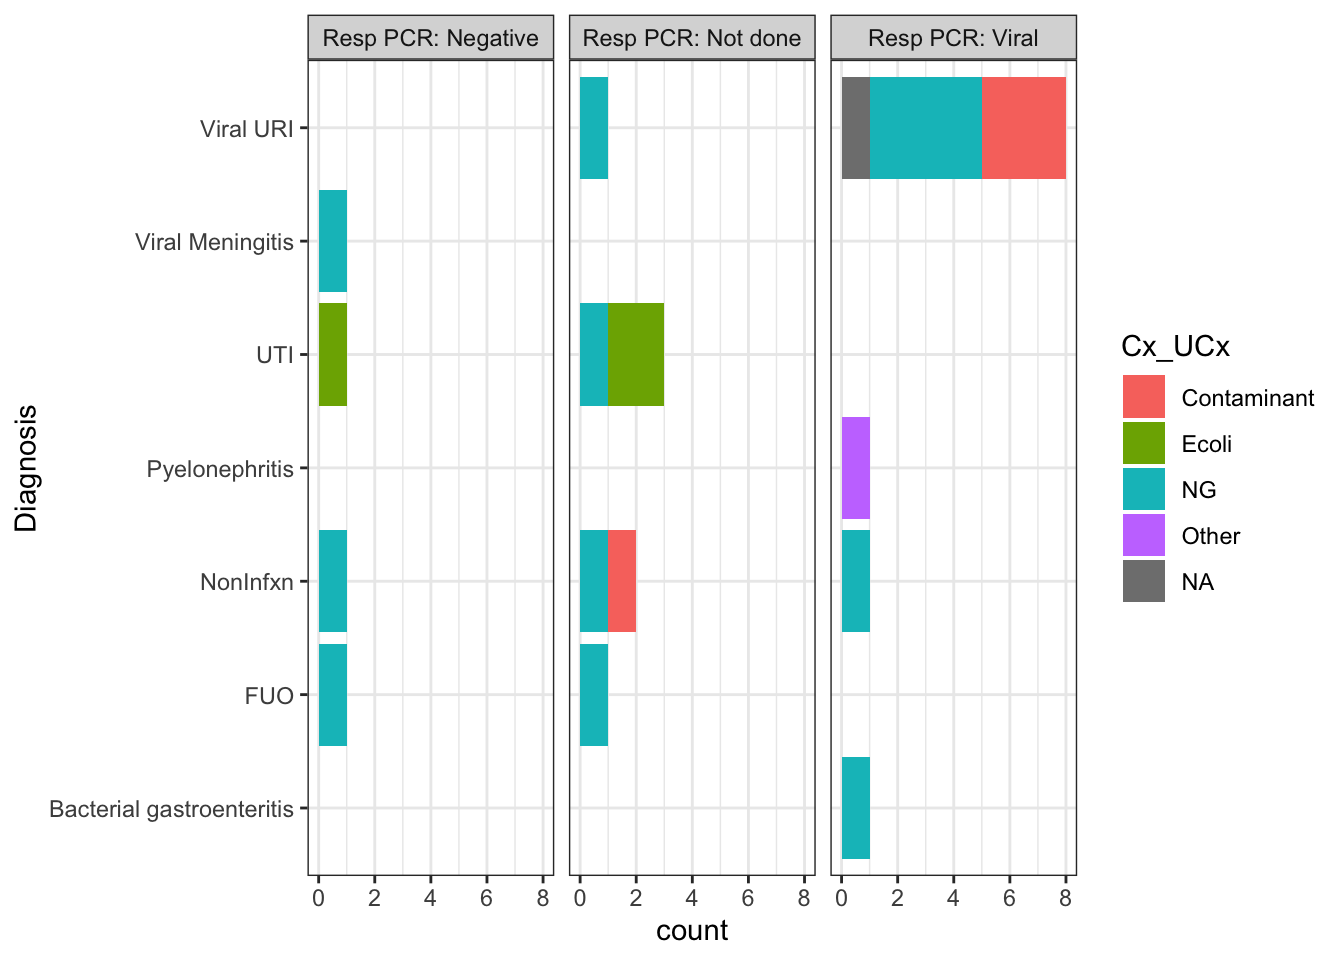
## 24.00003What about that odd result in figure 3?
Figure 4 showed that the median duration of antibiotics for subjects who did not get the CSF PCR (despite it being available) was zero hours. The explanation for this result is that the majority of these patients had the etiology of their fever identified by some other means (e.g. Resp PCR or UCx) and thus didn’t get an LP.
The graphs below shows only patients who did not get the CSF PCR, broken down by their ultimate diagnosis. The color of the bar represents the result of their urine culture, and the graphs are faceted by the result of their Resp PCR (e.g. Negative, Viral infection, or No resp PCR done).
Item for follow up for Hunter: Check RedCAP for subject 14. I think they just couldn’t get an LP on this pt, and presumed viral meningitis
Length of Stay
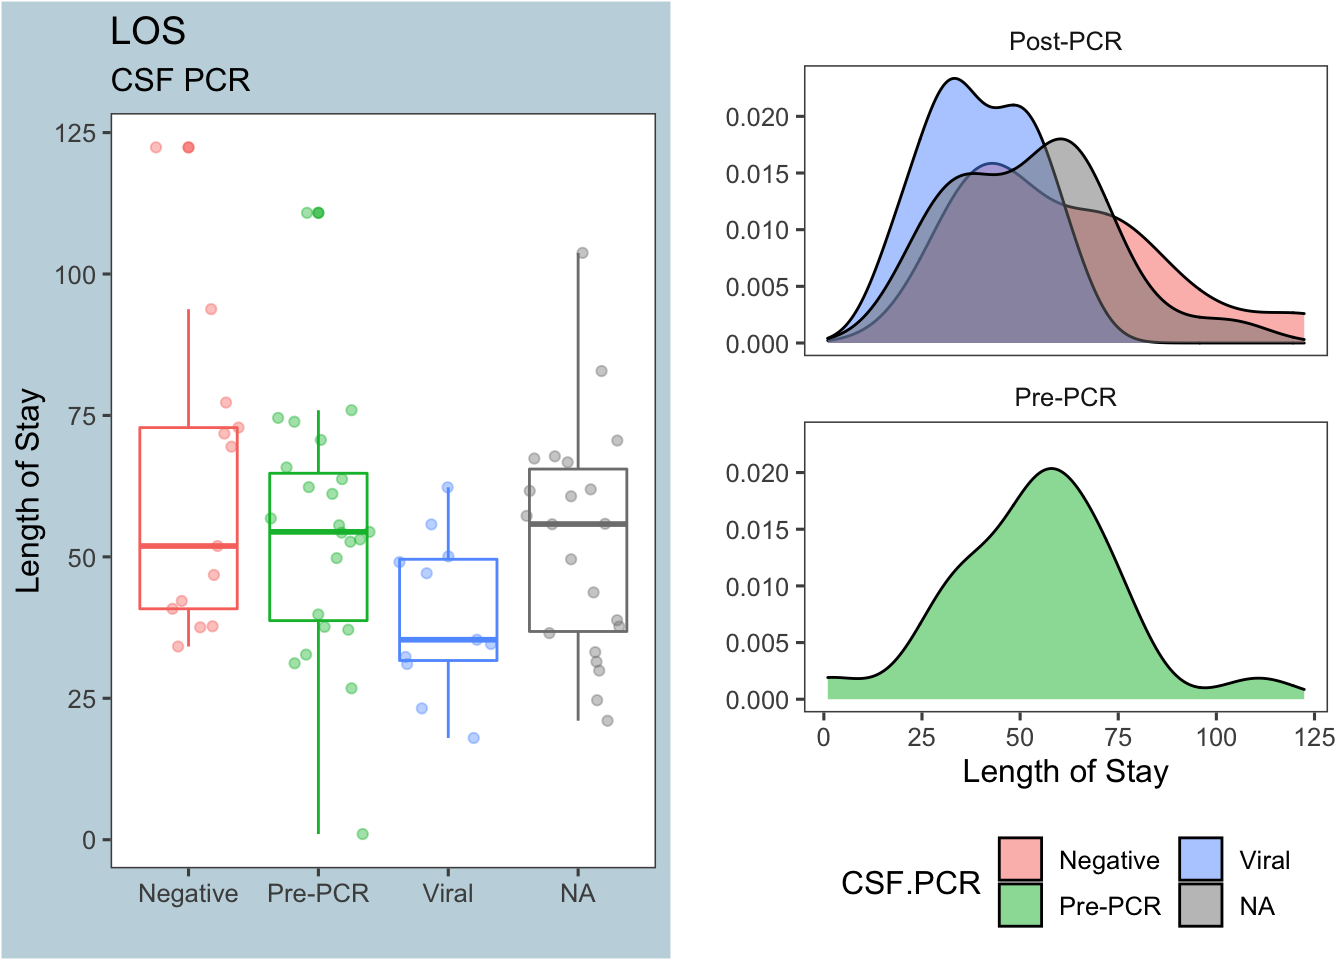
Figure 5: Length of stay by CSF PCR results
Figure 5 shows that a positive viral CSF PCR also decreases the length of stay. Again, the table below shows the summary stats for each group:
| PrePCR | CSF.PCR | median | mean | sd | nSubjects |
|---|---|---|---|---|---|
| Post-PCR | Negative | 51.92 | 61.44 | 26.29 | 13 |
| Post-PCR | Viral | 35.35 | 39.89 | 13.91 | 11 |
| Post-PCR | NA | 55.8 | 52.67 | 20.3 | 22 |
| Pre-PCR | Pre-PCR | 54.42 | 53.99 | 21.81 | 23 |
The Mann-Whitney test comparing length of stay between the PCR results Negative and Viral returns a p-value<0.05:
##
##  Wilcoxon rank sum test with continuity correction
##
## data:  los by CSF.PCR
## W = 109, p-value = 0.03206
## alternative hypothesis: true location shift is not equal to 0
## 95 percent confidence interval:
##   2.383321 38.250052
## sample estimates:
## difference in location
##               17.31663
Cultures / UA
As demonstrated in section 1.3, Blood cultures and CSF cultures were largely unhelpful in our study because they were mostly negative. Surprisingly, Figure 6 below shows that a clean UA didn’t have any influence on LOS or antibiotic duration
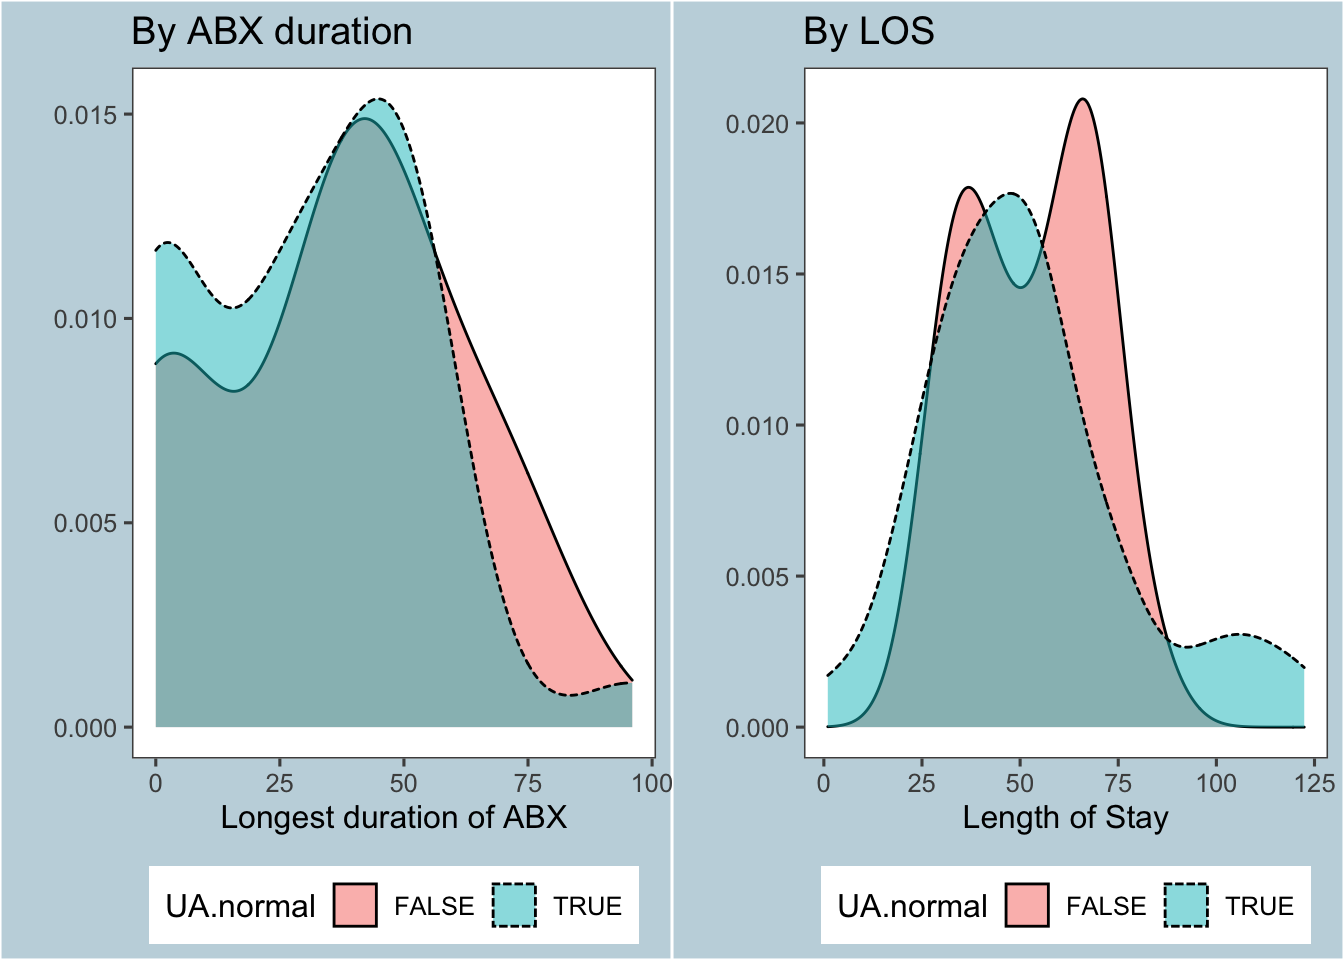
Figure 6: Effect of UA / UCx on primary outcomes
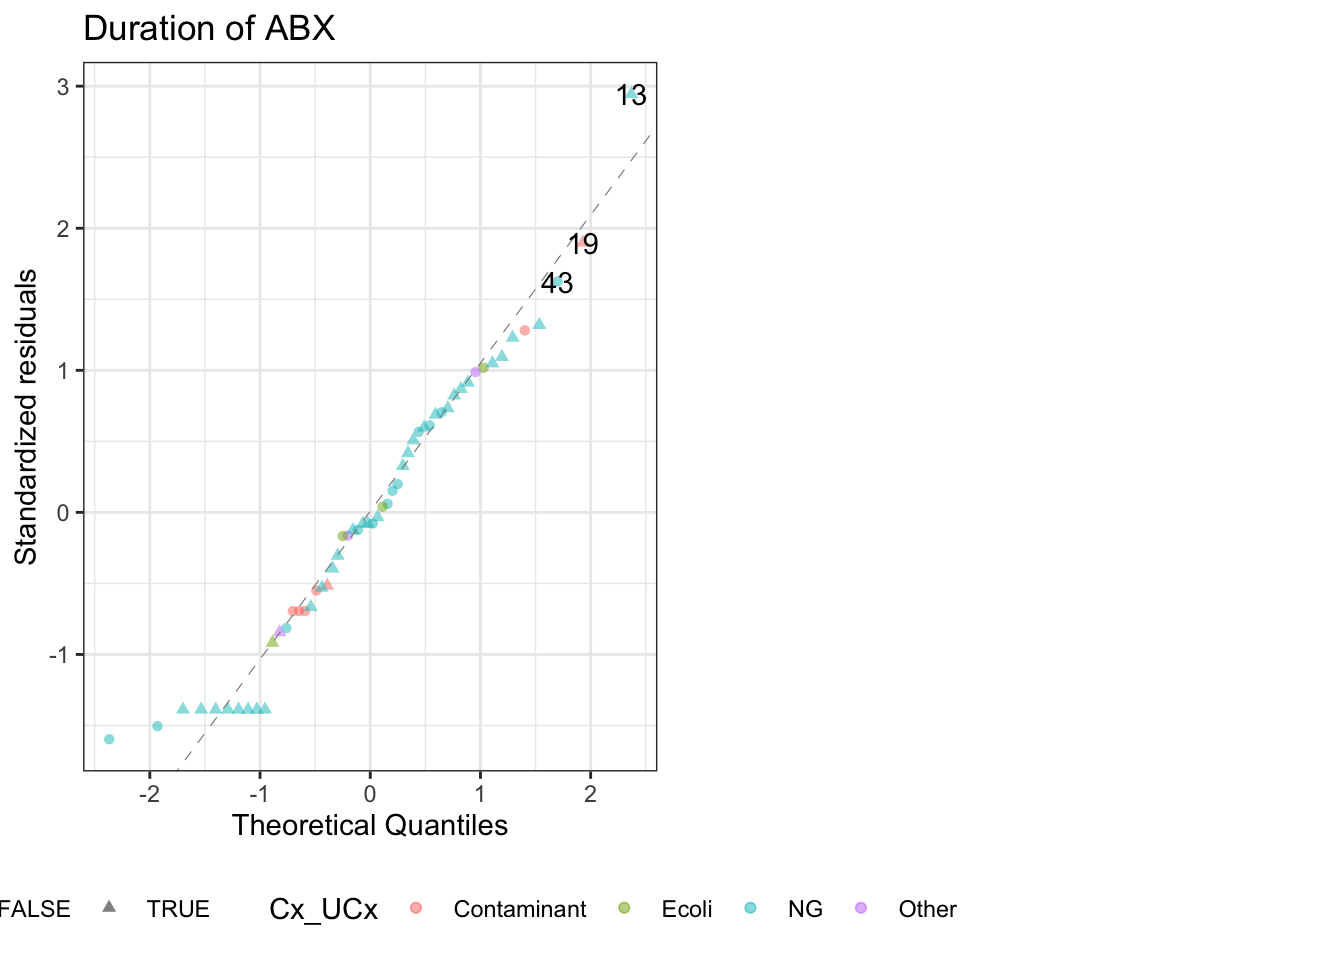
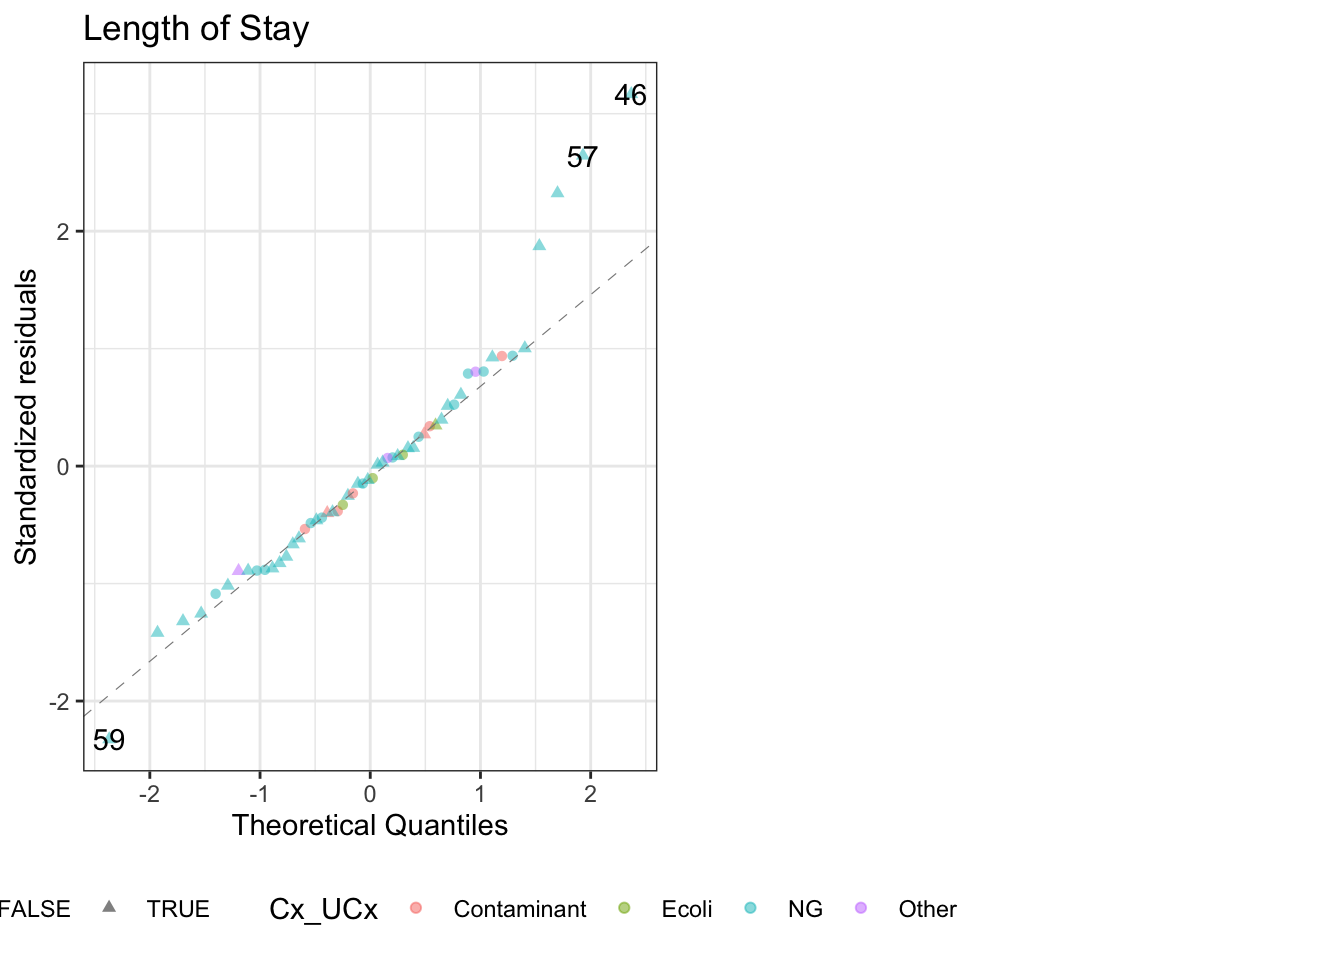
If we plug in the results of the UA and urine cultures into a linear model, we get the following models for antibiotic duration and LOS:
| Dependent variable: | ||
| maxHrABX | los | |
| (1) | (2) | |
| UA.normal | -3.934 | 2.069 |
| (6.662) | (6.645) | |
| Cx_UCxEcoli | 34.824** | 26.169* |
| (14.111) | (14.074) | |
| Cx_UCxNG | 20.281** | 7.785 |
| (9.623) | (9.598) | |
| Cx_UCxOther | 50.568*** | 25.692 |
| (15.537) | (15.496) | |
| Constant | 14.410 | 42.535*** |
| (8.718) | (8.696) | |
| Observations | 56 | 56 |
| R2 | 0.205 | 0.092 |
| Adjusted R2 | 0.143 | 0.021 |
| Residual Std. Error (df = 51) | 22.510 | 22.451 |
| F Statistic (df = 4; 51) | 3.297** | 1.291 |
| Note: | p<0.1; p<0.05; p<0.01 | |
FYI: The values in the table reads as Estimate (Std Error), with stars representing p-values at:
*= 10%**= 5%***= 1%
Work in progress: It’s not surprising that those who grew something in their urine had a longer duration on antibiotics. What is surprising is that even when accounting for the results of the urine culture, the UA still wasn’t significant.
QQ plots for these models:
If you exclude all subjects who were ultimately diagnosed with bacterial infections, there is a significant difference in the two eras for ABX duration, but not LOS↩
This is analyzing data in the aggregate. For further details, see these figures for duration of antibiotics for the Resp & CSF PCRs and these figures for the LOS for the Resp & CSF PCRs.↩
Anyone who had bacteremia in the context of a UTI or pyelonephritis↩
Hunter Ratliff, MD, MPH
Infectious Diseases Fellow
My research interests include epidemiology, social determinants of health, and reproducible research.